Engaging Teachers in Planning Relevant Staff Development

I recently posted "A Guide to Designing Effective Professional Development: Essential Questions for the Successful Staff Developer." I thought I'd follow up with an example of how those recommendations were followed in a recent professional development project.

This example comes from my recent work with the Edison School of Engineering & Manufacturing, a Rochester (NY)  City School District high school. We began the project by using one of the weekly early releases to do some agenda setting. I was introduced to the faculty and I spent about 40 minutes giving an outline of the types of PD subjects I could offer. I use a TurningPoint audience response system that gathered data to help us target our future PD.

We then utilized two more early release sessions to provide the requested training. I think it is critical to model the learning strategies in the session. That's especially true with PD is offered at the end of the school day. Feedback from teachers noted that they felt as if they were part of a learning environment that gave them a feeling for how the strategies would be perceived by the students.

Professional development need to move from the abstract setting of a training session into a real world classroom. So we next turned to Focus Classroom Walk-Throughs to develop a shared understanding of what the strategies look like when you are working with your students. I came back to the school on three additional days to conduct the walkthroughs.

Teachers were divided into teams of about six teachers and each team was led on a half-day walkthrough experience. Each session began with an orientation regarding goals and protocols. Our group of six was split into two smaller groups and visited classroom in teams of 2-3. We spent about 20 minutes per visit and regrouped all six teachers after visiting a few classes. 

All school faculty were aware of our walks and could elect to host a visit or opt out. We were not evaluating, nor passing judgement. Our goal was to hone our skills at identifying what we saw in the classroom. For example, could we look at classroom activity and agree on what level of Bloom we would assign to it?

After the classroom visits, I led each group in a debriefing with a focus on developing a shared understanding of what the strategies look like in the classroom. A “March Madness” analogy would be a group of observers discussing the defensive strategies they see being used in a basketball game. They share a common vocabulary and they are in full agreement about how to label what they observe.

Armed with a shared understanding of what how we would define our instructional strategies, we then turned to agenda setting for future PD. I led each walkthrough group in brainstorming session on how they would recommend we focus their future PD. I compiled input from all six brainstorming session into a report to the school based planning team. They then met to design their  09-10 professional development program.

Here's a Wordle of the top 50 comments from our brainstorm sessions.
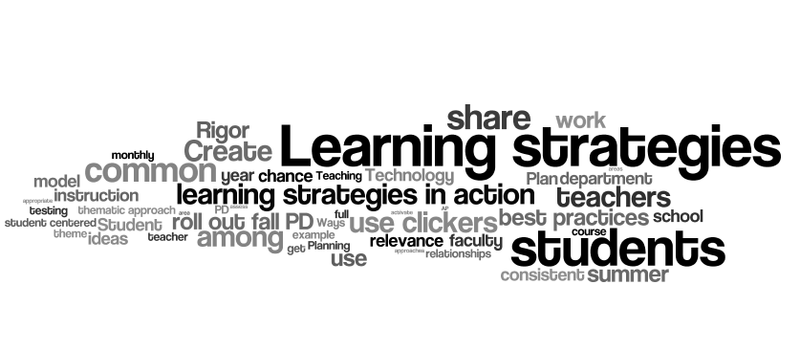
Brainstorm

How To Use Twitter to Virtually Network at the ASCD Conference 2009

I couldn't attend this year's ASCD conference currently going on in Orlando. That's a shame, since conferences are such a great place to meet new people and share ideas. So I thought I use Twitter to see if I can virtually meet folks and share thinking.  

First here's my elevator speech introduction – conference attendees pretend we just met over coffee…

Great to meet you… My name's Peter Pappas, from Rochester NY. I taught high school social studies for over 25 year, became a K-12 coordinator and then finished the last 5 years of my career as a assistant superintendent for instruction. Since then, I've been able to devote myself, full time, to expanding my role as a staff developer and consultant.

I've had the chance to work with districts across the country with a focus on literacy, technology, document-based instruction and student engagement. Staff development should model what we want to see in the classroom, so I bring an audience response system and we actually use the techniques I'm promoting!

Follow me on Twitter – hope you have a great conference!

Oh .. and … have you heard of any good sushi restaurants nearby? …..

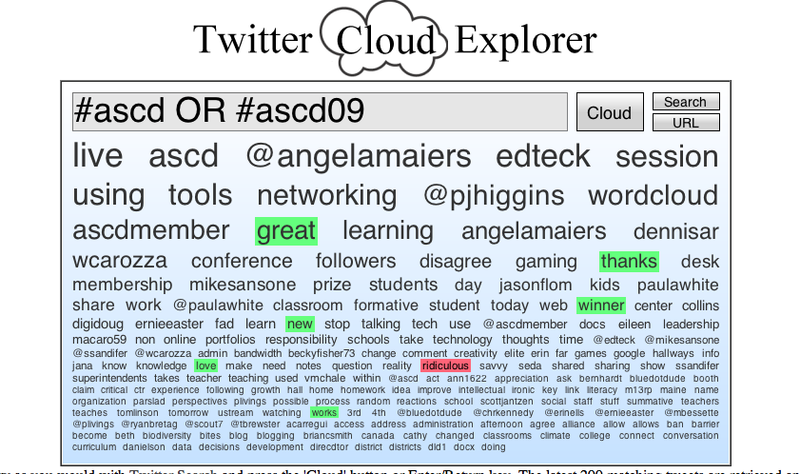
Note: As of 4/26/09 the TwitterCloudExplorer seems to have disappeared.  Here's a screen shot of what it looked like during the ASCD conference. Notice my Twitter name edteck was the 4th most Twittered word when I took the screen shot.

Twitter-cloud


Technical Specs

1. Hashtags are a community-driven convention for adding additional context and metadata to your tweets. They're like tags on Flickr, only added inline to your post. You create a hashtag simply by prefixing a word with a hash symbol: #hashtag.  I sought out the relevant hashtags people are using for the ASCD conference. Note: It seems this year both #ASCD and #ASCD09 are being used. For more on hashtags 
2. I used a Twitter Search to look for people using the #ASCD OR #ASCD09 hashtags. Search results here.

3. Then I sent out Tweets to people using either hashtag with a link back to this post. Hopefully their replies will follow.
4. I'm a big fan of quantitative display of information, so I used one the many new Twitter visualization tools – Twitter Cloud Explorer to generate this embedded query. Note: As of 4/26/09 the TwitterCloudExplorer seems to have disappeared.  There are many new Twitter visualizations coming along every day.

President Obama’s Education Policy Speech March 9, 2009

President Obama used a talk to the Hispanic Chamber of Commerce as a forum for a major address on administration education policy. Among his "four pillars of reform," he called for an expansion of charter school as "laboratories of innovation." For text transcript of Obama's speech click here. 

I decided to use Many Eyes to do a textual analysis of these two key words from his talk – "charter" and "innovation." I used the word tree visualization. 

Obama's use of the word "Charter"

Obama's use of the word "Innovation"

Many Eyes in the classroom
Many Eyes is a great new website that gives teachers and students a chance to easily use sophisticated graphic tools to analyze data and create interactive displays. Those who register at the site can use 16 visualization types to present data. Why not have your students use Many Eyes to analyze a selection of non-fiction text to uncover the main ideas and key vocabulary of the piece? Or they could compare text from different sources. Want your students to more fully understand your course content? Let them use Many Eyes to visualize and discover patterns as a catalyst for discussion and collective insights about information, text, and data. As they say at Many Eyes, "Finding the right way view your data is as much an art as a science. The visualizations provided on Many Eyes range from the ordinary to the experimental."

When to use a Word Tree
A word tree is a visual search tool for unstructured text, such as a book, article, speech or poem. It lets you pick a word or phrase and shows you all the different contexts in which it appears. The contexts are arranged in a tree-like branching structure to reveal recurrent themes and phrases.

Is Visuality the New Literacy?

Kevin Kelly’s recent piece “Becoming Screen Literate” (NY Times 11/23/08)  details our transition from text literacy to screen literacy. This movement has great implication for education. Information in our schools is organized in text-based lineal fashion. Our students live in a mosaic, imaged-based world in which visuality has become the new literacy.

Screens are everywhere. YouTube videos and Flickr images have become rich databases of component images and videos for yet new mash-ups and user-generated content. Kelly predicts this visual content will soon surpass our linguistic content as new tools will enable users to search, copy, modify and reassemble visual content with near word-processor efficiency.
 
Kelly writes, 

The rich databases of component images form a new grammar for moving images… After all, this is how authors work. We dip into a finite set of established words, called a dictionary, and reassemble these found words into articles, novels and poems that no one has ever seen before. The joy is recombining them. Indeed it is a rare author who is forced to invent new words. Even the greatest writers do their magic primarily by rearranging formerly used, commonly shared ones. What we do now with words, we’ll soon do with images

Below a TimeTube mashup creates a genealogy of most popular user-generated videos tagged Global Warming. 

Visualizing Data and Text – A Comparison Learning Strategy that Works

Comparing is the most powerful instructional strategy you can use in the classroom. But it's the person who does the comparing that's learning. Therefore, we must ask students to develop the comparison, not just learn and repeat the model that we present to them. (Remember, asking a student to fill out a Venn diagram that you created, is just a graphic form of information filing). After they have designed their comparison, students should also be asked to share what they learned.  A major component of 21st century literacy is finding meaningful ways to share information with others.

Many Eyes is a great new website that gives teachers and students a chance to easily use sophisticated graphic tools to analyze data and create interactive displays. Those who register at the site can use 16 visualization types to present data. My favorite visualization is the "Wordle," which enables you to see how frequently words appear in uploaded text, or see the relationship between a column of words and a column of numbers. You can tweak your word "clouds" with different fonts, layouts, and color schemes. Why not have your students use Wordle to analyze a selection of non-fiction text to uncover the main ideas and key vocabulary of the piece? Or they could compare text from different sources. Want your students to more fully understand your course content? Let them use Many Eyes to visualize and discover patterns as a catalyst for discussion and collective insights about information, text, and data. As they say at Many Eyes, "Finding the right way view your data is as much an art as a science. The visualizations provided on Many Eyes range from the ordinary to the experimental."

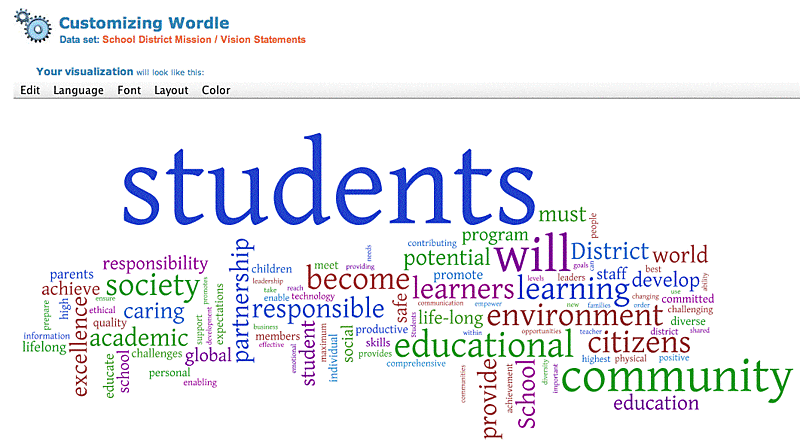
Here's a few examples of the same data in three different Wordle visualizations that analyze the frequency of words in 30 school district mission / vision statements. 

Click on images to enlarge.

Wordle1

The original data and was uploaded to Many Eyes by PPreuss and used to create the visualization above.  I modified the existing online data set mission / vision statement words with the Wordle tools to represent the same data in different layouts and styles. In this second version (below)  I limited the analysis to the top 100 words.

Wordle4

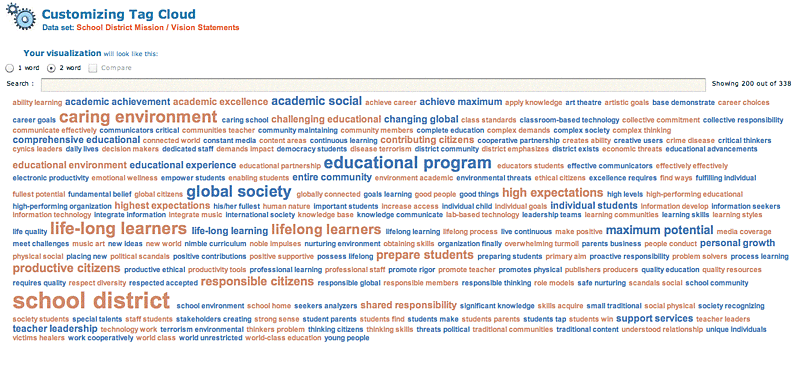
Here's a third representation of the same source data that analyzes 2-word clusters and displays their frequency in alphabetical layout. Below is  a screen shot of the Tag Cloud, but in its original form at Many Eyes, when I click on any of the word clusters,  a pop-up shows the context of how the cluster is used in different sentences from the source mission / vision statements.

Wow! Looks like we educators have a lot on our plates. Personally I think we might want to admit our mission / vision may simply be  "Trying Hard Not To Become Obsolete."

Wordle3