Visual Literacy: How Do Your Students Share Their Thinking?

The perceived audience / purpose for most student work is the teacher / because it was assigned. Learning becomes more meaningful when students are given chances to share their thinking with more authenticity. It's as simple as adding an audience to an assignment. Example: "How would you explain your solution to younger students?" This also opens the door to more relevant self evaluation. "Did my presentation suit my audience and purpose?"

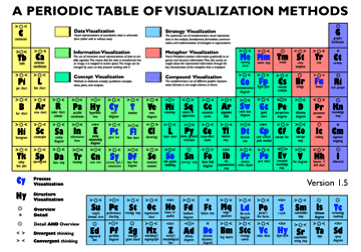
Periodic-table
Visual literacy is the ability to evaluate, apply, or create conceptual visual representations. Visual-Literacy.org has assembled a collection of visualizations in as a periodic table. Mouse over each element and a sample pops up. The examples range from simple to complex and they provide a vast array of approaches beyond the overused Venn diagram or T-chart. 

A pdf of the table is also available. On another page you can group the visualization methods by your criteria and  find background information for a specific visualization method via Google Images and Wikipedia

Principal Academy – Rigor and Relevance Walk-Through Training

This past week I conducted a series of walk-through training sessions for principals. Our workshops were hosted by North West Regional ESD and they took us through NWRESD's four-county service area in the northwest corner of Oregon – Washington, Clatsop, Columbia and Tillamook.

Each day opened with a discussion of rigor and relevance "look-for's." I used videos of classrooms that allowed the local principals to generate observations with "virtual walk-throughs." Then we traveled to a local school where we could work in small teams to hone our observations skills using this basic guide. (16 kb pdf.) The day closed with a full-group session where we processed our reflections. Our goal was to assist principals in fostering dialog with teachers about a more shared vision of teaching and learning.

Evaluations from the principals were positive  - they wrote:

The real walkthroughs were beneficial because I was practicing what we discussed in the morning.

This will push me to look for a deeper level of instruction from staff – a deeper level of learning in students.

Just the nudge I needed to "refocus" my professional conversations. I'll be looking at classrooms with a more focused lens.

It makes me want to go back to teaching students – I would be a much better teacher.

Fostering Creativity

idea festival
idea festival

Creating is Bloom’s highest level of thinking. Creating is not limited to “the creative.” We all create when we make new combinations of existing elements. Someone put wheels on the bottom of a scaled-down surfboard and created the skateboard. And so it goes…

While teachers and students are constrained by mind-numbing test prep, the rest of society is working overtime to foster creative connections. In September the annual “IdeaFestival” was held in Louisville, KY. It brings together creative thinkers from different disciplines to connect ideas in science, the arts, design, business, film, technology and education. The festival motto – “If it can possibly go together, it comes together here.” Why not apply that perspective in our schools?

Here are some suggestions from the festival on how to come up with new ideas. Many can be easily adapted to help our students discover their creative potential in the classroom.

1. Think when you are not thinking, for example, on a run or walk.
2. Listen to classical music, go to a concert or a play or sit quietly in a park to daydream.
3. Read periodicals you would not typically read — a scientific magazine, for example, if you are more interested in business. Same with books outside your typical genre.
4. Attend a conference outside your field.
5. Surround yourself with creative thinkers.
6. Immerse yourself in a problem; ask questions, investigate possible outcomes.
7. Keep an idea journal.
8. Take a course to learn a new language or some other skill outside your expertise.
9. Be curious and experiment.
10. Articulate your idea, seek feedback, put structure on it, harvest it.

Visualizing Data and Text – A Comparison Learning Strategy that Works

Comparing is the most powerful instructional strategy you can use in the classroom. But it's the person who does the comparing that's learning. Therefore, we must ask students to develop the comparison, not just learn and repeat the model that we present to them. (Remember, asking a student to fill out a Venn diagram that you created, is just a graphic form of information filing). After they have designed their comparison, students should also be asked to share what they learned.  A major component of 21st century literacy is finding meaningful ways to share information with others.

Many Eyes is a great new website that gives teachers and students a chance to easily use sophisticated graphic tools to analyze data and create interactive displays. Those who register at the site can use 16 visualization types to present data. My favorite visualization is the "Wordle," which enables you to see how frequently words appear in uploaded text, or see the relationship between a column of words and a column of numbers. You can tweak your word "clouds" with different fonts, layouts, and color schemes. Why not have your students use Wordle to analyze a selection of non-fiction text to uncover the main ideas and key vocabulary of the piece? Or they could compare text from different sources. Want your students to more fully understand your course content? Let them use Many Eyes to visualize and discover patterns as a catalyst for discussion and collective insights about information, text, and data. As they say at Many Eyes, "Finding the right way view your data is as much an art as a science. The visualizations provided on Many Eyes range from the ordinary to the experimental."

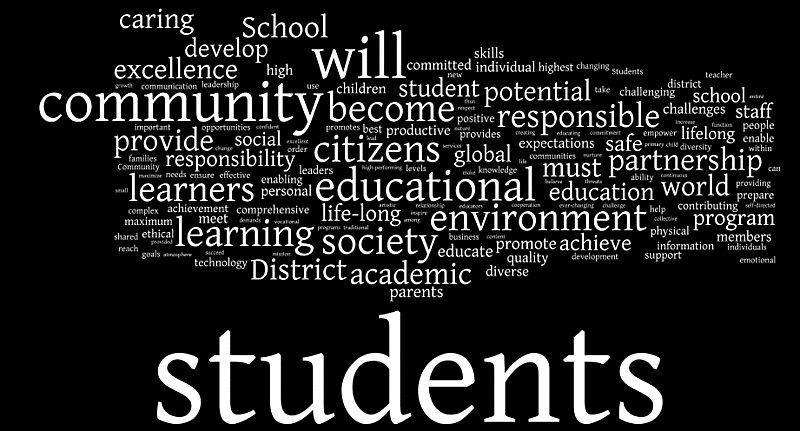
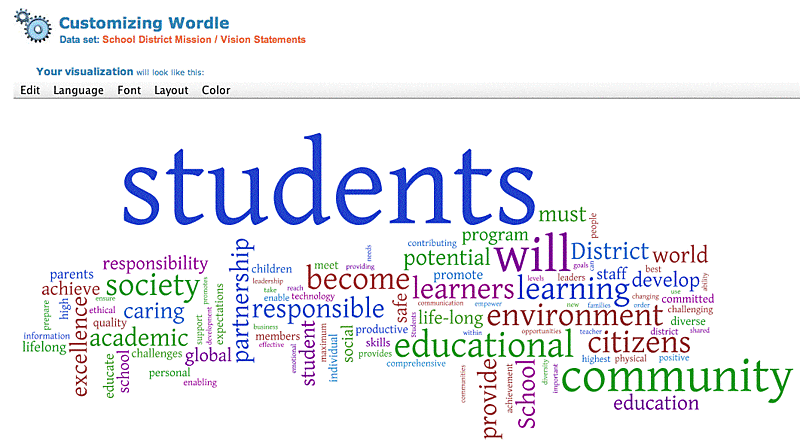
Here's a few examples of the same data in three different Wordle visualizations that analyze the frequency of words in 30 school district mission / vision statements. 

Click on images to enlarge.
Wordle1

The original data and was uploaded to Many Eyes by PPreuss and used to create the visualization above.  I modified the existing online data set mission / vision statement words with the Wordle tools to represent the same data in different layouts and styles. In this second version (below)  I limited the analysis to the top 100 words.
Wordle4

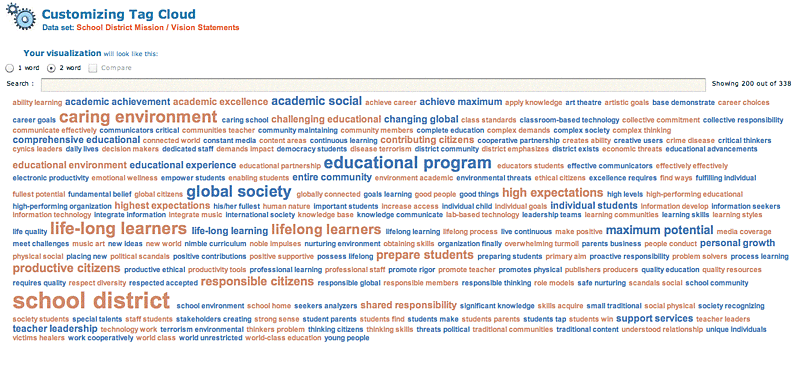
Here's a third representation of the same source data that analyzes 2-word clusters and displays their frequency in alphabetical layout. Below is  a screen shot of the Tag Cloud, but in its original form at Many Eyes, when I click on any of the word clusters,  a pop-up shows the context of how the cluster is used in different sentences from the source mission / vision statements.

Wow! Looks like we educators have a lot on our plates. Personally I think we might want to admit our mission / vision may simply be  "Trying Hard Not To Become Obsolete."
Wordle3