The perceived audience / purpose for most student work is the teacher / because it was assigned. Learning becomes more meaningful when students are given chances to share their thinking with more authenticity. It's as simple as adding an audience to an assignment. Example: "How would you explain your solution to younger students?" This also opens the door to more relevant self evaluation. "Did my presentation suit my audience and purpose?"
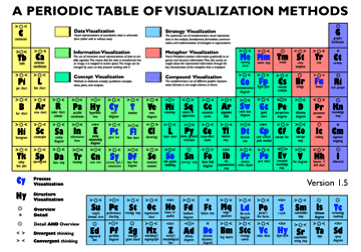
Visual literacy is the ability to evaluate, apply, or create conceptual visual representations. Visual-Literacy.org has assembled a collection of visualizations in as a periodic table. Mouse over each element and a sample pops up. The examples range from simple to complex and they provide a vast array of approaches beyond the overused Venn diagram or T-chart.

