How To Quantify Culture? Explore 500 Billion Published Words With Google’s Books Ngram Viewer

By now you must be aware that Google has been busy digitizing books – over 5 million are now available for free download and search. Recently Google Labs has made public a giant database of of names, words and phrases found in those books (along with the years they appeared). It consists of the 500 billion words contained in scanned books published between 1500 and 2008 in English, French, Spanish, German, Chinese and Russian. 

Google Labs has just posted the “Books Ngram Viewer” – a free online research tool that allows you to quickly analyze the frequency of names, words and phrases -and when they appeared in the digitized books. You type in words and / or phrases (separated by comma), set the date range, and click “Search lots of books” – instantly you get the results. Note: when “smoothing” is set to “0” the results will show raw data. Using a higher number produces an average – example “4” will give you four year running averages that will more readily display trends. 

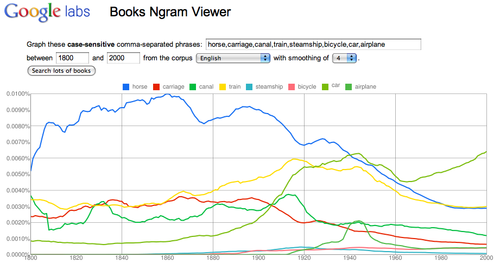
In this graph I searched “horse, carriage, canal, train, steamship, bicycle, car, airplane” and set the date range to 1800 – 2000.  Link to this transport graph at Books Ngram Viewer The results offer some insights into when these new transportation terms found their way into print. 

Transport-1

I think Books Ngram Viewer has many interesting applications in the classroom. The first that comes to mind, is as tool to introduce the research method – form hypothesis, gather and analyze data, revise hypothesis (as needed), draw conclusions, assess research methods. Working in teams students can easily pose research questions, run the data, revise and assess their research strategy. Students can quickly make and test predictions. They can then present and defend their conclusions to other classroom groups. All skills called for by the new Common Core standards.

Using the Ngram viewer, will enable students to discover many insights which will require revisions to their research strategies – a great way to explore word usage, social context and statistics. Words have multiple meanings. In my transport example “car” appears in the graph long before the advent of the automobile. Was it used as railroad car? In contrast to newspapers, events and trends take time to find their way into books. “Pearl Harbor” does not reach a peak until 1945.

The frequency of occurrence scale is important (vertical Y-axis.) If you graph a high frequency word against a low frequency word(s), the low is reduced to a flat line at the base of the scale. (Abraham Lincoln and Marilyn Monroe) Remove the high frequency (Abraham Lincoln) and re-run the graph – the low frequency (Marilyn Monroe) will appear with more detail. 

Need inspiration for nGrams? For a collection of clever searches Click here.

Updates: 

NGram Viewer has added a * wildcard feature. More on how to use it here Hat tip to Jean-Baptiste Michel of the nGram team who emailed me “In English, the data is good in 1800-2000, but not really before or after. Past that date, it looks like the composition of the corpus is changing; trends would indicate a shift in the corpus, not a shift in the underlying culture. So really, one shouldn’t look at data past 2000 in English.”

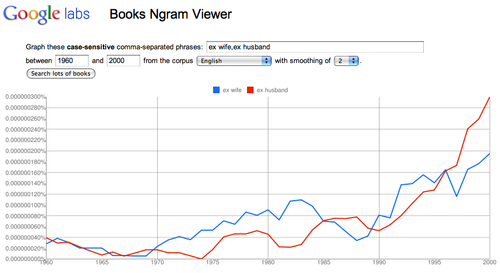
Analyze societal values: “ex wife, ex husband”  
 Changing laws and social values?
Watch the change in the Y-axis scale – add “my ex” to the original graph.

Ex-1

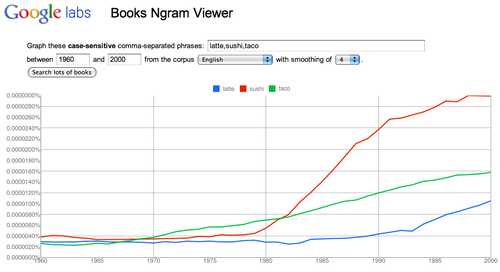
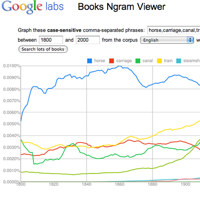
Track trends: “latte, sushi, taco”
Link to graph 
Are these new food fads?
Latte-1
 

Stop Worrying About Shanghai, What PISA Test Really Tells Us About American Students

Sputnik replica
Sputnik replica

The latest results from the Program for International Student Assessment (PISA) are public, and already some pundits are declaring it “a Sputnik wake-up.” Others shout back that international comparisons aren’t valid. Rather than wade into that debate, I’d rather look more closely at the questions in the PISA test and what student responses tell us about American education. You can put international comparisons aside for that analysis. 

Are American students able to analyze, reason and communicate their ideas effectively? [Think Common Core standards] Do they have the capacity to continue learning throughout life? Have schools been forced to sacrifice creative problem solving for “adequate yearly progress” on state tests? For more on that last question see my post “As NCLB Narrows the Curriculum, Creativity Declines.” 

PISA provides some answers to those questions and offers an insight into the type of problem solving that rarely turns up American state testing. FYI: PISA is an assessment (begun in 2000) that focuses on 15-year-olds’ capabilities in reading literacy, mathematics literacy, and science literacy. PISA assesses how well prepared students are for life beyond the classroom by focusing on the application of knowledge and skills to problems with a real-life context. For more examples of PISA questions and data click here. 

Do American students learn how to sequence or simply memorize sequences

Here’s one insight into what American students can (and cannot) do that can be gleaned from the 2003 PISA test results. We spend a lot of time in school getting students to learn sequential information – timelines, progressions, life cycle of a moth, steps for how to. Typically the teacher teaches the student the sequence and the student correctly identifies the sequence for teacher on the test. Thus we treat a sequence as a ordered collection of facts to be learned, not as a thinking process for students to use.  This memorization reduces the student’s “mastery” of the chronology to lower order thinking. I was guilty of this when I first started teaching history “Can someone give me two causes and three results of WWII?” 

Sample sequencing problem from PISA

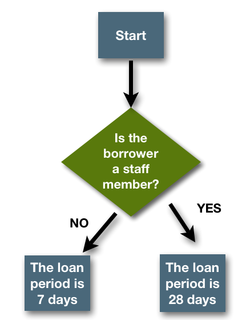
The Hobson High School library has a simple system for lending books: for staff members the loan period is 28 days, and for students the loan period is 7 days. The following is a decision tree diagram showing this simple system:

Pisa-1

The Greenwood High School has a similar, but more complex library lending system:
All publications classified as “Reserved” have a loan period of 2 days.
For books (not including magazines) that are not on the reserved list, the loan period is 28 days for staff, and 14 days for students. For magazines that are not on the reserved list, the loan period is 7 days for everyone.
Persons with any overdue items are not allowed to borrow anything. 

Task

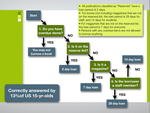
Develop a decision tree diagram for the Greenwood High School Library system so that an automated checking system can be designed to deal with book and magazine loans at the library.  Your checking system should be as efficient as possible (i.e. it should have the least number of checking steps). Note that each checking step should have only two outcomes and the outcomes should be labeled appropriately (e.g. “Yes” and “No”).

Student Results

Only 13.5% of US students were able correctly answered the question. Does it really matter if students in Shanghai did any better? (The student results were rated on a rubric scale.) 

When students are asked to observe a process and develop a sequence they have an opportunity to use a full spectrum of higher-order thinking skills – they must recognize patterns (analyze), determine causality (evaluate) and then decide how they would communicate what they’ve learned to others (create). Sequencing can be taught across the curriculum at a variety of grade levels – we simply have to ask the students to observe and do the thinking.

In case you’re wondering,  correct response should look like this.
Click image to enlarge.

pisa answer
pisa answer 
 

Image credit/ NASA
 

Education for Innovation or More Test Prep?

Intel is hosting an education digital town hall at the Newseum that will explore new ways to “cultivate tomorrow’s thinkers and entrepreneurs to sustain economic and educational success.” (December 7 at 8:45 a.m. – 11:45 EST) Participants include Education Secretary Arne Duncan; Angel Gurria, the Secretary General of the Organization for Economic Co-operation and Development; Rob Atkinson with ITIF; and Tom Friedman of the New York Times.

Let’s see how the Duncan sidesteps the issue of testing and innovation – while US students spend endless hours honing their test taking skills, the demand for routine skills has disappeared from the workplace. Anyone know of a meaningful and rewarding career that looks like filling out a worksheet? Maybe Friedman will be willing to tackle the stifling impact of testing on creativity thinking among our students. For my thoughts on the subject, see my post “As NCLB Narrows the Curriculum, Creativity Declines

“Education for Innovation” a live digital town hall 

Watch the video here.

You can submit questions you would like the moderators, PBS NewsHour’s Gwen Ifill and Hari Sreenivasan, to discuss with the speakers. Then, vote the questions you like best to the top. Click here

You can join the for the live, interactive webcast on Tuesday, December 7 at 8:45 a.m. – 11:45 EST or join the conversation at Twitter/InnovationEcon use the hashtag #Ed4Innovation
 

PISA-sample


More on the Program for International Student Assessment (PISA)

PISA is an assessment (begun in 2000) that focuses on 15-year-olds’ capabilities in reading literacy, mathematics literacy, and science literacy. PISA studied students in 41 countries and assessed how well prepared students are for life beyond the classroom by focusing on the application of knowledge and skills to problems with a real-life context. For a detailed example of how PISA assesses sequencing skills see my post “Why Don’t We Teach Sequencing Skills?


For more PISA questions in reading, math and science see my blog post “Are Students Well Prepared to Meet the Challenges of the Future?” You can find some great critical thinking questions to use with your students


Response to sample question
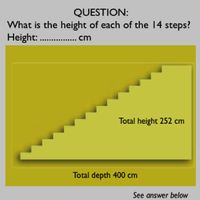
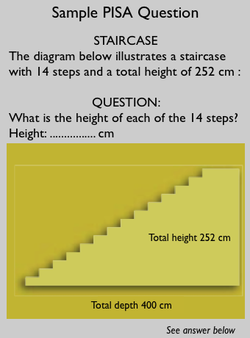
This short response question is situated in a daily life context. The student has to interpret and solve the problem which uses two different representation modes: language, including numbers, and graphical. This question also has redundant information (i.e., the depth is 400 cm) which can be confusing for students, but this is not unusual in real-world problem solving. The actual procedure needed is a simple division. As this is a basic operation with numbers (252 divided by 14) the question belongs to the reproduction competency cluster. All the required information is presented in a recognizable situation and the students can extract the relevant information from this. The question has a difficulty of 421 score points (Level 2 out of 6).

9 Questions for Reflective School Reform Leaders

Blueprint1 In response to the November 22: Day of National Blogging for Real Education Reform, I have posed nine questions for school leaders to consider. They’re organized around three themes and a concluding recommendation. (Note: each theme also resonates in the new Common Core standards).

Readers might also want to review my post “A Taxonomy of Reflection: Critical Thinking For Students, Teachers, and Principals

Theme 1. Learning must engage student in rigorous thinking at higher levels of Bloom – analyzing, evaluating and creating. School leaders should ask:

1. Does our school community recognize the difference between higher and lower order thinking?
2. Are students expected to just consume information, or are they asked to create something original that demonstrates their learning?
3. Is our school a creative problem-solving organization? 
Answers: We cut music and art for remedial math. (Wrong!!!)
 We recognize music and art are vehicles to teach math. (That’s better!)

Theme 2. Learning is relevant when the student understands how the information or skill has some application to their life, has an opportunity to figure out their own process rather than just learn “the facts,” and is given opportunities to reflect on their work and their progress as learners. School leaders should ask …

4. Do our students get high grades for simply memorizing the review sheet for the test?
5. Do our students “follow the recipe” or are they increasingly asked to take responsibility for their learning products, process and results?
6. Is the audience for student work simply the teacher, or are students asked to share their learning with peers, family, community?

Theme 3. The digital age has redefined literacy. To paraphrase David Warlick, literacy now means the ability to: find information, decode it, critically evaluate it, organize it into digital libraries, be able to share it with others and stay focused on a task. School leaders should ask …

7. If we’re no longer the “information gatekeepers,” are we teaching our students to critically evaluate information and use it responsibly?
8. Does our technology get used mainly by the educators, or are students regularly employing it to create understanding and share their learning?
9. Is our credit system based on seat time or can it be expanded beyond the school walls to any place / time virtual learning?

I find it ironic that while schools chase NCLB “proficiency,” life has become an open book test. We need to unleash the power of assessment that targets and inspires. One-shot, high stakes tests are just autopsies. Students need regular check-ups where teachers can gauge student progress and target instruction. Ultimately the program must be designed to foster student self-assessment that gives them responsibility for monitoring their own progress. Students should be supported in on-going self-reflection that addresses questions such as:

  • How can I use this knowledge and these skills to make a difference in my life?
  • How am I progressing as a learner?
  • How can I communicate what I’m learning with others?
  • How can I work with teachers and other students to improve my learning?

Schools will need to become places that create engaging and relevant learning experiences, provoke student reflection, and help students apply the learning to life. Authentic  accountability is reciprocal …  leadership is responsible to provide resources for success, educators are responsible for results. Simply sorting students along the “bell curve” won’t do.

Analyzing the History of the Bicycle: A Prezi DBQ

Prezi-DBQ

Click here to go the Prezi.
Then click “More” to view full screen. Use arrows at base of Prezi to navigate forward and back through a predefined path. Or use your mouse to explore and zoom the Prezi. Click on hyperlinks in the Prezi to more information about the historic bicycles.
For a PDF version of the Prezi click here.

I’m pleased to have been invited by the educators at the Smithsonian Institution to do a guest blog post using museum resources. It’s a great opportunity to illustrate a question that I often pose to educators – when do we stop modeling for students and free them to take responsibility for their learning? For example, the document-based approach (DBQ) can be a great way for students to “be the historian,” but too often we “over curate” the historic material we share with students. When that happens, the teacher is the active historian and the student is merely a passive recipient of information. For more on that subject see my post: Essential Question: Who is the Teacher in Your Classroom? All across the curriculum, students are told to “analyze” material, but their thinking is constrained by the mandated Venn diagram or T-chart. Developing a comparative schema is messy work – but that’s where the learning takes place. (Hint: letting students do the work is also central the the Common Core standards.) When the student fills out the teacher’s Venn diagram, they aren’t analyzing, they’re filing information into predefined locations. 

Of course, students do need proper scaffolding. Opportunities to learn different analytic models – cause / effect, problem / solution, sequencing, continuity / change. It makes sense to provide them some graphic organizers to help master the models. But at some point, you must turn them loose and give them the chance to explore, discover, create. Put another way, if your entire class comes back with the same comparative analysis – you did the thinking, they didn’t.

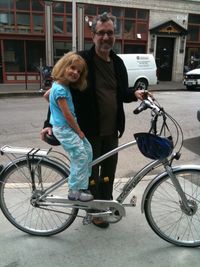
Zoe with Electra I was attracted to the Smithsonian Bicycle collection for two reasons. From an academic perspective, the images of historic bicycles could be analyzed by students without a great deal of background knowledge. My lesson provides a minimum of explanation and gives students more opportunities to develop their own model of how bicycles and bicycle culture evolved over time. On the personal side, much of the year, I live in Portland Oregon –  heartland of the urban bike culture. We don’t own a car, but rely on our bikes, walking and public transport. (That’s me with granddaughter Zoe on my Electra Townie bike). 

Some of my photographs of contemporary bikes are from Portland, where creative types continue to evolve new designs. I’ve been using Prezi on my blog and in my presentations since it was launched. For many years I’ve been an advocate of the DBQ. This is my first attempt to combine the two. 

Step 1: Choosing the Analytic Approach Students need experience using a variety of analytic approaches. Continuity and change is a perspective that has a central role in historic/chronological thinking and it can be used in other disciplines across the curriculum. In this lesson, students are given images of historic bicycles with a minimal amount of supporting text. Starting with concrete observations, students look for patterns of change and continuity (elements that changed, e.g., size / number of wheels, speed, stability and those that remained relatively constant , e.g., human powered, seated posture, need for brakes).  Finally, they are asked develop a way to express what they’ve learned. This gives them an audience other than their teacher.

7 dad-son Step 2: Making It Relevant To make learning relevant and set the stage for self-reflection, students need the opportunity to explore their own approaches. For this reason, I don’t provide a graphic organizer. That would mean that I, not the students, did the analysis. This opened-ended assignment invites students to develop their own graphic or narrative model to express what they’ve learned. Another aspect of relevance is authentic audience and purpose. Therefore I recommend that students be asked to think of how they would share their continuity/change model with younger students.

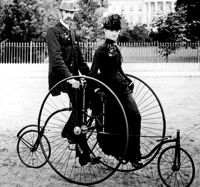
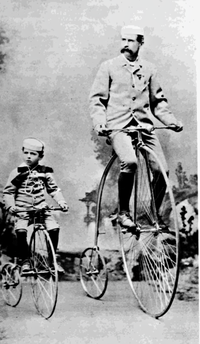
At left: Man astride “1882 Columbia Expert” with son?

Step 3: Making It Rigorous Students should begin by focusing on the lower level comprehension skills (What am I looking at? What materials were used? How were bicycles propelled and steered?) Next they can move to higher level skills.

  • Analysis – What patterns do I see in the bicycles – construction, design, features, uses? What elements do they share in common? How do they differ?
  • Evaluation – In my own judgment, what elements are changing? Which are staying the same? 
  • Creating – What have I learned about continuity and change in the history of the bicycle? How can I represent what I’ve learned to share with others? Should I use a graphic organizer? Flow chart? Time line? Diagram? Narrative?

Step 4: Encouraging Students to Reflect On Their Learning Students that have the opportunity to explore their own approaches have a learning experience that can be a basis for reflection. Since they will likely develop different analytic models than their classmates, they have a chance to compare and learn from each others’ conclusions. When asked to develop a way to explain their model to younger peers, students can reflect on how their model suits their audience and purpose. For reflective prompts you can use with your students see my Taxonomy of Reflection.

Step 5: Taking It Further These possible activity extensions can encourage students to think more about bicycles continuity, and change.

  • Consider how contemporary bicycles fit your continuity / change model, e.g., recumbent, mountain, fixed gear.
  • Design a bicycle
  • Apply the continuity / change model in another subject or discipline – fashion, architecture, musical styles, advertising, fictional characters… I could go on, but I hope you see the potential for learning.
  • Technology extension – Student could also be invited to view the world’s public photography archives at the Flickr Commons with a search by bicycle.They could help describe the photographs they discover by adding tags or leaving comments. The collection includes works from the Smithsonian and other leading international photographic archives.