Design Your Website from the Bottom Up

Design Your Website from the Bottom Up

Web-design

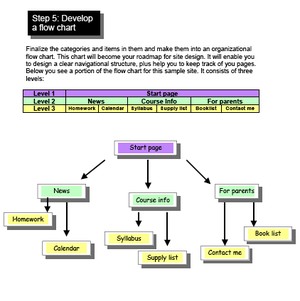
For months, I’ve noticed a steady stream of searches on this blog for “Design Your Website” or “Bottom Up.” I realized folks were looking for a PDF that I created back in 2000 as part of my web design class – we’re talking “old school” FrontPage webs! I started teaching web design to students and teachers back in 1997. Over 10+ years I helped hundreds of teachers and students get started.


I thought since people are still looking, I’d repost the PDF on my blog and save them some search time. Download Design Website From the Bottom Up 200KB pdf

Design tools have evolved greatly since then, but I think the “bottom up” approach still offers a useful perspective for thinking about information design. 

Reader smight also find some useful (but dated) resources at my site “Website Design for Teachers

How To Quantify Culture? Explore 500 Billion Published Words With Google’s Books Ngram Viewer

By now you must be aware that Google has been busy digitizing books – over 5 million are now available for free download and search. Recently Google Labs has made public a giant database of of names, words and phrases found in those books (along with the years they appeared). It consists of the 500 billion words contained in scanned books published between 1500 and 2008 in English, French, Spanish, German, Chinese and Russian. 

Google Labs has just posted the “Books Ngram Viewer” – a free online research tool that allows you to quickly analyze the frequency of names, words and phrases -and when they appeared in the digitized books. You type in words and / or phrases (separated by comma), set the date range, and click “Search lots of books” – instantly you get the results. Note: when “smoothing” is set to “0” the results will show raw data. Using a higher number produces an average – example “4” will give you four year running averages that will more readily display trends. 

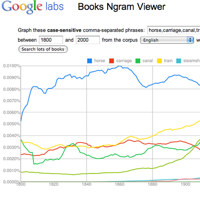
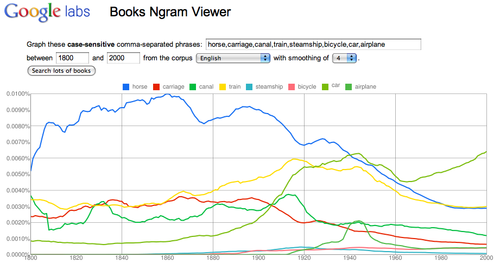
In this graph I searched “horse, carriage, canal, train, steamship, bicycle, car, airplane” and set the date range to 1800 – 2000.  Link to this transport graph at Books Ngram Viewer The results offer some insights into when these new transportation terms found their way into print. 
Transport-1

I think Books Ngram Viewer has many interesting applications in the classroom. The first that comes to mind, is as tool to introduce the research method – form hypothesis, gather and analyze data, revise hypothesis (as needed), draw conclusions, assess research methods. Working in teams students can easily pose research questions, run the data, revise and assess their research strategy. Students can quickly make and test predictions. They can then present and defend their conclusions to other classroom groups. All skills called for by the new Common Core standards.

Using the Ngram viewer, will enable students to discover many insights which will require revisions to their research strategies – a great way to explore word usage, social context and statistics. Words have multiple meanings. In my transport example “car” appears in the graph long before the advent of the automobile. Was it used as railroad car? In contrast to newspapers, events and trends take time to find their way into books. “Pearl Harbor” does not reach a peak until 1945.

The frequency of occurrence scale is important (vertical Y-axis.) If you graph a high frequency word against a low frequency word(s), the low is reduced to a flat line at the base of the scale. (Abraham Lincoln and Marilyn Monroe) Remove the high frequency (Abraham Lincoln) and re-run the graph – the low frequency (Marilyn Monroe) will appear with more detail. 

Need inspiration for nGrams? For a collection of clever searches Click here.

Updates: 

NGram Viewer has added a * wildcard feature. More on how to use it here Hat tip to Jean-Baptiste Michel of the nGram team who emailed me “In English, the data is good in 1800-2000, but not really before or after. Past that date, it looks like the composition of the corpus is changing; trends would indicate a shift in the corpus, not a shift in the underlying culture. So really, one shouldn’t look at data past 2000 in English.”

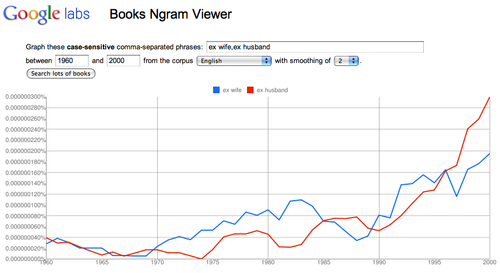
Analyze societal values: “ex wife, ex husband”  
 Changing laws and social values?
Watch the change in the Y-axis scale – add “my ex” to the original graph.
Ex-1

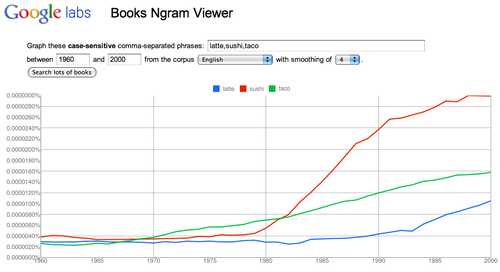
Track trends: “latte, sushi, taco”
Link to graph 
Are these new food fads?
Latte-1
 

Lesson Study: Teacher-Led PD That Works

One of the best aspects of my work is that I get to meet many talented educators. I'm on the road this week, and I invited two of them to do guest posts. The first comes from Matt Karlsen, Project Director of Teaching American History Grants at ESD 112 in Vancouver, Washington. Matt and I first connected on Twitter then recently met over coffee.  I was impressed with the success his group's Lesson Study approach.

There's a hysterical video called “Collaborative Planning” currently going viral.  It’s a "laugh until you cry" feast, one that lays bare the hypocrisy too often evident in teacher professional development where teachers are forced into “Professional Learning Teams” that are none of the above.

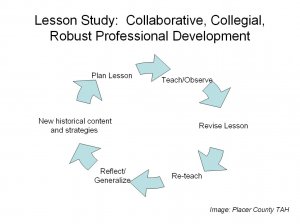
Ls-image1 Thankfully, I’ve been able to work with teachers for the last several years using Lesson Study, a format that is collegial, educative, and transformative.  In our Teaching American History grant funded project, Lesson Study starts with teachers learning new historical content.  They consider state and national thinking and learning targets and examine their students’ work to get a sense of their students’ strengths and struggles.  They form teams to develop a lesson trying to impact student skills and knowledge.  At the same time as helping students answer questions about the historical content, they’re research lessons – helping teachers answer questions they have about teaching and learning.  The group gathers to watch students interact with the lesson, spending the rest of the day discussing observations using this protocol.

Why does it work?

  1. It’s inquiry driven.  Genuine questions guide teachers and students, and the quality of the questions is continually refined to better the learning.  It fosters curiosity.
  2. Teachers are in control.  They decide the lesson targets, the questions they want students to consider and the “problems of practice” they want to investigate.  
  3. Students are the focus.  Ultimately, everything depends on what real students do with the lesson.  Kid-watching eyes are developed as observations become the talking points.
  4. It’s flexible and adaptable.  Regardless of who, what, where, or for how long you’ve been teaching, the process works.

Want to learn more?  

  • Catherine Lewis from Mills College has played a large role in adapting Lesson Study from Japan to the US. The Lesson Study Group at Mills College Resource Page offers links to many informative articles, videos, and books.
  • Oakland Unified School District’s Teaching American History Grants have paved the way for considering Lesson Study in History.  The two videos posted on their site are inspirational starting points for understanding the process.
  • Feel free to contact me (Matt)  to talk about Lesson Study!  It was through open collaboration with others – including Catherine Lewis, Stan Pesick in Oakland, Roni Jones in Placer County, and our TAH partners – that I’ve been able to move down this path.  Let’s extend the Lesson Study professional learning community!
  • Two useful documents for download: 2010-11 LS Review Sheet  and  LS Observation & Debriefing Protocol -Fall 2010

+++++++++++++++

Interested in more teacher-friendly PD? Read my posts: 

Teacher-Led Professional Development: Eleven Reasons Why You Should be Using Classroom Walk Throughs 

A Guide to Designing Effective Professional Development: Essential Questions for the Successful Staff Developer 

The Reflective Teacher: The Taxonomy of Reflection


Turn Your Students into Data-Driven Decision Makers

How is your educational technology being used? Teacher in front of the class lecturing on the smartboard? Or are students using ed tech to analyze, evaluate and create in ways that were not previouslypossible. I’ve written about one example, Wordle, a free Web 2.0 tool that enables students to interpret, qualify and visualizes text in new ways.

Another powerful data visualizer is the Motion Chart. It’s a dynamic flash-based chart that explores multiple indicators and visualizes growth over time. Gapminder World has assembled 600 data indicators in international economy, environment, health, technology and much more. They provide tools that students can use to study real-world issues and discover trends, correlations and solutions. Here’s Gapminders’s Hans Rosling showing how teachers and students can use the free Gapminder Desktop to develop there own motion charts using Gapminder data. 

To download a free version of Gapminder Desktop and access more educational resources go to Gapminder for Teachers. If you would like to build motion charts using your own data visit Google Gadget Motion Chart. (It’s the engine behind Gapminder.)  Motion Chart is a free gadget in Google Spreadsheet. In Motion Chart you can convert your data-series into a Gapminder-like graph and put it on your web-page or blog. All you need is a free Google-account. More info on Motion Chart 

New educational technology does not automatically improve the quality of instruction. We have all sat through dull PowerPoint presentations that were as “mind-numbing” as an overhead. Our return on technology investments may not be tracked in test scores that simply measure lower-order recall of information. A better metric would gauge if an educational technology gave students the tools to analyze, evaluate and create as professionals do. All skills demanded by the new Common Core standards.

Five Ways to Engage Students and Other Audiences – Tips for Teachers and Presenters

I’ve been invited by West Clermont Local Schools (Cincinnati OH) to do an opening day presentation for secondary teachers. This is not the first time we’ve collaborated. Earlier this year,  I assisted them in this project – “How to Use Web 2.0 to Create On-line Professional Development.” Looks like they have their PD act together!

The topic they assigned me for this week’s presentation is “How to engage students in the 21st century classroom.” This post outlines the message I’ll take to West Clermont. While the primary audience for this post is teachers in the classroom, I think there’s also a useful message for presenters who want to connect with their audience.

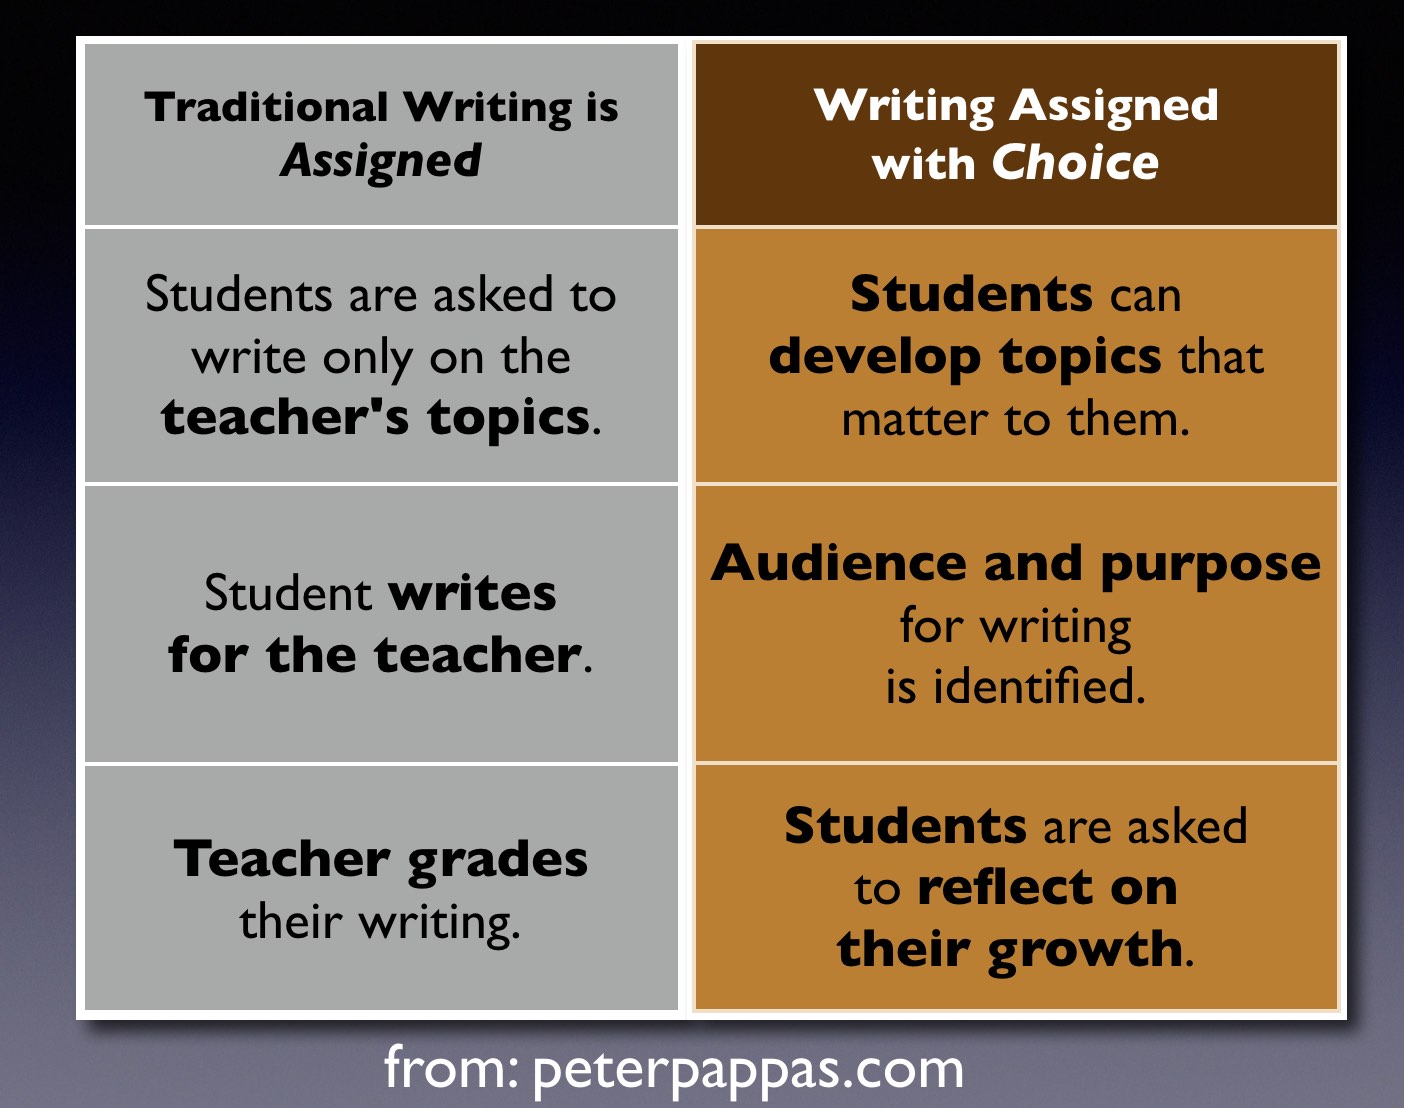
1. Remember that engagement is founded on choice: A task becomes engaging when you have an opportunity to make choices about content, process and product. For example here’s a diagram that shows how easy it is to transform a traditional writing assignment into a more engaging one.

See “First Day of School? Here’s How to Get Students Thinking” for a student-centered way to kick off the school year.

2. Alter the traditional information flow: All the one-way broadcast information sources are losing audience – TV, record industry, teachers who lecture. I’ll bring my TurningPoint audience response system to give them space in the information stream. We’ll also capture “backchannel” dialog with a Wiffiti screen. More on using Wiffiti in presentations. [Note: Discussion was so lively – I didn’t get a chance to use Wiffiti. A good problem!]

3. Thinking critically is more engaging than listening: Knowledge is only superficially transmitted by telling someone something. Students (and audiences) are engaged when you create learning environments that require them to apply their own analysis and evaluation to constructing meaning. Make it partial assembly required.

As a teacher, I was always turned off by trainers who weren’t using the strategies they were advocating. My workshops give the teachers a taste of how students will respond to the strategies in an authentic learning experience. As one teacher commented in her evaluation of my workshop, “Peter demonstrated his own method for rigor and relevance while teaching us, so we participated as our students would. The workshop was effective because he made us reflect on our classroom practice and our expectations of students. Then he supplied us with techniques and strategies to improve instruction.”

4. Relinquish responsibility for learning to the student (also this blog’s tagline): Students can develop their own iTunes genre scheme – what make you think they can’t analyze, evaluate and create? Many teachers feel they’re competing (unsuccessfully) with technology for student attention. I see things differently. Students aren’t engaged with technology because it lights up and beeps. They’re engaged with technology because it puts them in charge of information they access, store, analyze and share. It gives them something they rarely get in the classroom – choice. The lesson revision I outline in point 1 is about control (not technology) in the classroom.

5. Always keep in mind that the essence of teaching (or presenting) is creating learning experiences that provoke reflection: Students who are simply asked to follow instruction have nothing to reflect upon. (The same is true for audiences who have been asked to do little more than listen). Students who are offered the opportunity to explore their own approaches and share them with their peers are well on their way to life-long learning. I’ll bet “life-long learning” is in your school district mission statement – or is it vision statement? (I could never remember if I was on a mission or having visions). For more on reflection, see my series detailing my Taxonomy of Reflection.

PS. Here’s my “handout” for the West Clermont workshop. Download Engagement-presentation (3MB pdf). It’s a glimpse into my workshop – but I can’t “hand” you the message. Remember, it’s about the experience (and reflection) not simply the content.