How to Use Web 2.0 to Teach Literacy Strategies to Struggling Readers

This week I’m heading out to work with intermediate (grade 4-6) teachers on strategies to assist struggling readers.

We’ll focus on three core skill areas central to the Common Core standards – defining, summarizing and comparing using my guide to 18 Strategies for Struggling Readers. (free PDF file)

Plus I’ll introduce some great websites that they can use with the strategies – the new digital literacy meets the old text literacy.

There are two key elements in each skill area that can help students construct meaning and build background knowledge.

Defining

  • Before the formal definition has been introduced, students should be asked to make connections between their prior knowledge and the term.
  • After the term has been defined, students need activities to more deeply process the term. The focus should be on descriptions, not definitions

Summarizing

  • Students should be asked to make their own judgments about what’s important to them (instead of just repeating the details the teacher highlights).
  • Students will be able to more readily summarize, if they are asked to share what they’ve learned with an audience other than the teacher. They need use a text structure to organize their thinking.

Comparing

  • Students should develop the comparison, not simply repeat the model that we present to them.
  • Student should be asked to share what they learned from the comparison. They need use a text structure to organize their thinking.

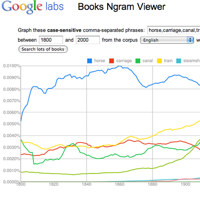
I’ve selected some Web 2.0 sites that will enable students to use the strategies in a variety online settings. I’ve picked free sites that have easy learning curves.  For example, we will use One Word to negotiate meaning through images, explore summarizing text structures with Five Card Flickr and design comparisons with Wordle and Books nGram Viewer.

Working with words

  1. Explore word frequency with Wordle
  2. Search published works with Google Books Ngram Viewer
  3. Foster writing skills with One Word writing prompts
  4. Expand vocabulary and word choice with TelescopicText 

Working with words and images

  1. Create mindmaps and graphic organizers with Bubbl.us  
  2. Drag and drop words to create poem based on a photo with Pic-Lits
  3. Foster visual thinking and creative writing with Five Card Flickr

Kid-friendly search sites

  1. SweetSites
  2. Ask Kids

For more ways to use Web 2.0 sites in the classroom
download a free PDF at my post
87 Free Web 2.0 Projects For the K-12 Classroom

Image credit flickr/Mike Licht

How To Quantify Culture? Explore 500 Billion Published Words With Google’s Books Ngram Viewer

By now you must be aware that Google has been busy digitizing books – over 5 million are now available for free download and search. Recently Google Labs has made public a giant database of of names, words and phrases found in those books (along with the years they appeared). It consists of the 500 billion words contained in scanned books published between 1500 and 2008 in English, French, Spanish, German, Chinese and Russian. 

Google Labs has just posted the “Books Ngram Viewer” – a free online research tool that allows you to quickly analyze the frequency of names, words and phrases -and when they appeared in the digitized books. You type in words and / or phrases (separated by comma), set the date range, and click “Search lots of books” – instantly you get the results. Note: when “smoothing” is set to “0” the results will show raw data. Using a higher number produces an average – example “4” will give you four year running averages that will more readily display trends. 

In this graph I searched “horse, carriage, canal, train, steamship, bicycle, car, airplane” and set the date range to 1800 – 2000.  Link to this transport graph at Books Ngram Viewer The results offer some insights into when these new transportation terms found their way into print. 

Transport-1

I think Books Ngram Viewer has many interesting applications in the classroom. The first that comes to mind, is as tool to introduce the research method – form hypothesis, gather and analyze data, revise hypothesis (as needed), draw conclusions, assess research methods. Working in teams students can easily pose research questions, run the data, revise and assess their research strategy. Students can quickly make and test predictions. They can then present and defend their conclusions to other classroom groups. All skills called for by the new Common Core standards.

Using the Ngram viewer, will enable students to discover many insights which will require revisions to their research strategies – a great way to explore word usage, social context and statistics. Words have multiple meanings. In my transport example “car” appears in the graph long before the advent of the automobile. Was it used as railroad car? In contrast to newspapers, events and trends take time to find their way into books. “Pearl Harbor” does not reach a peak until 1945.

The frequency of occurrence scale is important (vertical Y-axis.) If you graph a high frequency word against a low frequency word(s), the low is reduced to a flat line at the base of the scale. (Abraham Lincoln and Marilyn Monroe) Remove the high frequency (Abraham Lincoln) and re-run the graph – the low frequency (Marilyn Monroe) will appear with more detail. 

Need inspiration for nGrams? For a collection of clever searches Click here.

Updates: 

NGram Viewer has added a * wildcard feature. More on how to use it here Hat tip to Jean-Baptiste Michel of the nGram team who emailed me “In English, the data is good in 1800-2000, but not really before or after. Past that date, it looks like the composition of the corpus is changing; trends would indicate a shift in the corpus, not a shift in the underlying culture. So really, one shouldn’t look at data past 2000 in English.”

Analyze societal values: “ex wife, ex husband”  
 Changing laws and social values?
Watch the change in the Y-axis scale – add “my ex” to the original graph.

Ex-1

Track trends: “latte, sushi, taco”
Link to graph 
Are these new food fads?

Latte-1
 

Turn Your Students into Data-Driven Decision Makers

How is your educational technology being used? Teacher in front of the class lecturing on the smartboard? Or are students using ed tech to analyze, evaluate and create in ways that were not previouslypossible. I’ve written about one example, Wordle, a free Web 2.0 tool that enables students to interpret, qualify and visualizes text in new ways.

Another powerful data visualizer is the Motion Chart. It’s a dynamic flash-based chart that explores multiple indicators and visualizes growth over time. Gapminder World has assembled 600 data indicators in international economy, environment, health, technology and much more. They provide tools that students can use to study real-world issues and discover trends, correlations and solutions. Here’s Gapminders’s Hans Rosling showing how teachers and students can use the free Gapminder Desktop to develop there own motion charts using Gapminder data. 

To download a free version of Gapminder Desktop and access more educational resources go to Gapminder for Teachers. If you would like to build motion charts using your own data visit Google Gadget Motion Chart. (It’s the engine behind Gapminder.)  Motion Chart is a free gadget in Google Spreadsheet. In Motion Chart you can convert your data-series into a Gapminder-like graph and put it on your web-page or blog. All you need is a free Google-account. More info on Motion Chart 

New educational technology does not automatically improve the quality of instruction. We have all sat through dull PowerPoint presentations that were as “mind-numbing” as an overhead. Our return on technology investments may not be tracked in test scores that simply measure lower-order recall of information. A better metric would gauge if an educational technology gave students the tools to analyze, evaluate and create as professionals do. All skills demanded by the new Common Core standards.

Forget About Remembering, It’s Focus That’s the New Literacy

 
focus page
focus page

The cost of information is rapidly approaching zero. Normally as price of a commodity drops, we consume more of it. But unlike all the other cheap stuff we buy, and then later discard, cheap information demands our attention. Despite all the claims of multi-tasking, we are stuck with a finite attention span. Thus the ability to selectively filter out unwanted information and stay focussed on a task is emerging as a new literacy.

Students are adrift in a sea of text without context.  As the barriers to content creation have dropped, old media (for all its flaws) has been replaced by pointless mashups, self-promoting pundits, and manufactured celebrity. Educators must help students make more effective use of the information that fills their lives – how to better access it, critically evaluate it, store it, analyze, share it, and maintain their focus. An essential goal of the Common Core standards.  For more on how we need to redefine the information flow in school see my post “What Happens in Schools When Life Has become an Open-book Test?

Recently David Dalrymple, a researcher at the MIT Mind Machine Project, made an insightful contribution to the The Edge Annual Question — 2010 “How is the internet changing the way you think?“ He wrote, 

“Filtering, not remembering, is the most important skill for those who use the Internet. … Before the Internet, most professional occupations required a large body of knowledge, accumulated over years or even decades of experience. But now, anyone with good critical thinking skills and the ability to focus on the important information can retrieve it on demand from the Internet, rather than her own memory. On the other hand, those with wandering minds, who might once have been able to focus by isolating themselves with their work, now often cannot work without the Internet, which simultaneously furnishes a panoply of unrelated information — whether about their friends’ doings, celebrity news, limericks, or millions of other sources of distraction. The bottom line is that how well an employee can focus might now be more important than how knowledgeable he is. Knowledge was once an internal property of a person, and focus on the task at hand could be imposed externally, but with the Internet, knowledge can be supplied externally, but focus must be forced internally.”

If you need a visual reminder of the swamp of information that your students are wading through take a look at this video “InfoWhelm and Information Fluency” from the 21st Century Fluency Project

Seeing American History Through the Artist’s Eye: A Teaching and Learning Resource

Thomas Hart Benton - Boomtown The Education department at the University of Rochester’s Memorial Art Gallery has just launched a new web feature which pairs works of art with teaching strategies.  

Their new teaching / learning site, Seeing America,  documents the Gallery’s outstanding collection of American Art through 82 works and their connections to American history, culture, literature and politics.

The accompanying Classroom Guide integrates background information on the art, the artist and America with visual literacy classroom activities. Lesson plans and resources are readable online and available as downloadable pdfs. 

Download a pdf sample Context and Classroom Activities for
 
Thomas Hart Benton’s Boomtown. (above)

After you’ve had a chance to view the site leave a comment with your responses. I’ll pass them along to my friends at the Education department.  

*****

If your interested in world art, take a look at my blog post “Picturing the Story – An Interdisciplinary Approach to Culture, Environment, Language, and Learning.”  I served as an advisor to the Education department’s last teaching site – “Picturing the Story: Narrative Arts and the Stories They Tell.” It uses world art from the permanent collection of the Memorial Art Gallery dating from 1500 BCE to the 20th Century. Each work has a story to tell, either visually through imagery and symbol, or indirectly through custom and ritual. The stories reflect sacred beliefs, folk traditions, common human experiences, or unique cultural practices.