Google Chromebook: 1-to-1 Computing for $180 per Student?

Google-chrome-logo-1000 This week Google launched the Chromebook – a cloud-based "laptop" priced at $20 per month. That's $180 per student for a nine-month school year. Not a bad price for 1 to 1.

It's built on the already popular Google Chrome and Google apps platform. (I'm using both with increasing regularity).  It will be a tempting offer for schools – instant on, always connected – plus no software installs, anti-virus, or upgrades to worry about. Run it at school on the district WiFi, then take it home and use 3G – Verizon is providing 100mb of data per month for free. 

The Chromebook will raise big questions about collection of personal student data, internet security and acceptable use policies. But Google claims to have features in place which offers granular controls on web access (1st graders can't get to sites that might be acceptable to high schoolers.) 

I wonder if schools will take the bait? If I were the school IT guy – I'd be nervous. If it turns out Chromebook works as advertised, I might be out of work.

On second thought – I should get one for my mother. That's an IT job I'd like to lose!

3 Ways to Use Social Media to Crowdsource and Blog a Conference Backchannel

conference backchannel

One of the goals of my blog is to research, curate and effectively share information with my audience. Conferences are a great aggregator of expertise and information that have inspired some of my most popular blog posts. Here’s three strategies that I’ve used to crowdsource my research and harness the conference backchannel. All three tools employ hashtags – the popular practice where conference attendees include a common tag in their tweets. Typically conference organizers will designate an official hashtag – some combination of letters / numbers prefixed with a hash symbol “#.”

Use Twitter Visualizers
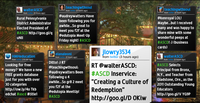
Wiffiti There are many great Twitter visualizers that can be set up to automatically gather specific Twitter #hashtags. Two of my favorites are Wiffiti and Twitter StreamGraphs. Wiffiti displays entire tweets, while StreamGraphs graphs frequency of keywords within the tweets. Both are interesting visualizations of the conference backchannel. Each tool is free and can be embedded on your blog. And neither requires you to attend the conference. 

Here’s how I used these visualizers  to cover the 2010 ASCD conference. 
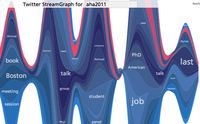
Streamgraph For some fun, I used StreamGraphs to blog “comparative coverage” of two conferences that were in session at the same time in this post, “Humanities Conference Smackdown! AHA vs MLA Twitter Visualizers.”


Use Prezi

Itsc11-prezi Prezi is a presentation tool that adds a dimension of space and scale to information. It can be displayed both as a stand alone presentation and embedded on a blog. Here’s how I used Prezi at the ITSC 2011 conference in Portland Ore, where I had been invited to attend as a guest blogger. My onsite tools included my MacBook, iPhone and Flip Video.

During the conference I attended sessions to gather photos / video and tweeted my observations along the way. I also gathered content from other attendees by following the conference hashtag #ITSC11. The finished Prezis can include – tweets, images, video, YouTube video, PDF’s, screenshots, text, hyperlinks and clipart.

Periodically I gathered all the content and created a Prezi. (BTW – I used the same Prezi technique to blog the San Antonio ASCD in 2010.)  


Use Storify
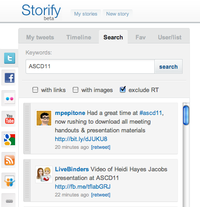
Storify Storify is a new platform that allows users to quickly tell a story using material from the social web. Recently I received an invitation to try out their beta and I’ve been putting it to use as conference blogging tool. 

The Storify web-based interface divides your screen in two columns. On the left (screenshot – to the left) are a variety of social media feeds – Twitter, FaceBook, Flickr, YouTube, RSS feeds, Google searches, SlideShare as well as any URL you select. It also has built in search tools that allow you explore your sources using hashtags. My favorite feature is that the Twitter search allows you to exclude RTs. As you find your content,  you drag it to the right side of your screen where you also have options to add text, delete or re-order content. When your Storify finished it can be embedded in your blog. To help you get the word out Storify sends out a Tweet to anyone you have quoted. 

Here’s how I used Storify to cover the recent 2011 ASCD conference in San Francisco. I received many positive comments from viewers who thought I gathered some of the best social media being posted from the conference. I saved them the time of wading through all the RTs, side comments, and promotional tweets. BTW – I did not attend the conference. 

Stay tuned for may ongoing conference coverage – I’m sure there’s a new tool being created that I’ll get to take for a spin!


How to Use Web 2.0 to Teach Literacy Strategies to Struggling Readers

This week I’m heading out to work with intermediate (grade 4-6) teachers on strategies to assist struggling readers.

We’ll focus on three core skill areas central to the Common Core standards – defining, summarizing and comparing using my guide to 18 Strategies for Struggling Readers. (free PDF file)

Plus I’ll introduce some great websites that they can use with the strategies – the new digital literacy meets the old text literacy.

There are two key elements in each skill area that can help students construct meaning and build background knowledge.

Defining

  • Before the formal definition has been introduced, students should be asked to make connections between their prior knowledge and the term.
  • After the term has been defined, students need activities to more deeply process the term. The focus should be on descriptions, not definitions

Summarizing

  • Students should be asked to make their own judgments about what’s important to them (instead of just repeating the details the teacher highlights).
  • Students will be able to more readily summarize, if they are asked to share what they’ve learned with an audience other than the teacher. They need use a text structure to organize their thinking.

Comparing

  • Students should develop the comparison, not simply repeat the model that we present to them.
  • Student should be asked to share what they learned from the comparison. They need use a text structure to organize their thinking.

I’ve selected some Web 2.0 sites that will enable students to use the strategies in a variety online settings. I’ve picked free sites that have easy learning curves.  For example, we will use One Word to negotiate meaning through images, explore summarizing text structures with Five Card Flickr and design comparisons with Wordle and Books nGram Viewer.

Working with words

  1. Explore word frequency with Wordle
  2. Search published works with Google Books Ngram Viewer
  3. Foster writing skills with One Word writing prompts
  4. Expand vocabulary and word choice with TelescopicText 

Working with words and images

  1. Create mindmaps and graphic organizers with Bubbl.us  
  2. Drag and drop words to create poem based on a photo with Pic-Lits
  3. Foster visual thinking and creative writing with Five Card Flickr

Kid-friendly search sites

  1. SweetSites
  2. Ask Kids

For more ways to use Web 2.0 sites in the classroom
download a free PDF at my post
87 Free Web 2.0 Projects For the K-12 Classroom

Image credit flickr/Mike Licht

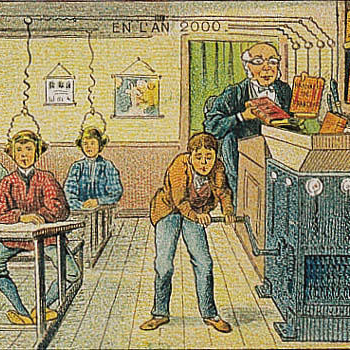
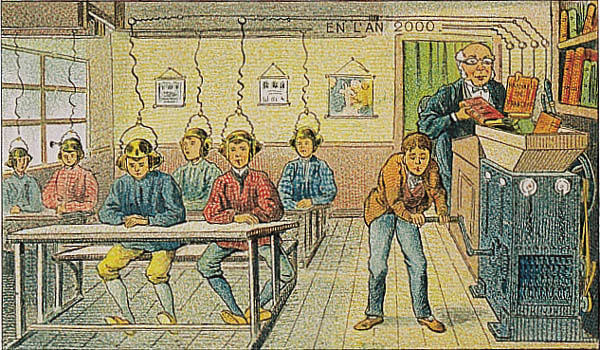
Vintage 1910 French Postcard Predicts Bill Gates and NCLB

What an uncanny prediction of contemporary American education – digitized information being force-fed into bored students. Looks like a vision of one of those computerized test prep programs guaranteed to bring up the standardized test scores.

But I’m not sure – do you think that’s educational savior - Bill Gates, or an overpaid public school teacher unwilling to give away his collective bargaining rights?

For another satirical look at the current education scene see yesterday’s post –
John Stewart “Teachers are Destroying America

NCLB-predicted

Click image to enlarge

Part of series of images (circa 1910) attributed to French artist Villemard in which he predicted Paris life in 2000. Hat tip to D’Arcy Norman

For another uncanny prediction, see my postFirst Google Map Discovered – Created in 1652

Historypin – Make DBQs with a Digital Time Machine That Layers Image, Story and Location

While planning for my next document based question (DBQ) workshop, I discovered Historypin. It’s a great mashup of digital photos with stories layered over Google maps. Users can search images by geography / time and post historic photos with stories to maps. It’s fascinating to view historic photographs set against the backdrop of current Google map street view.

Historypin

Here’s a circa 1894 photo I uploaded to Historypin showing a bridge crossing the Erie Canal in downtown Rochester NY. It’s layered over a functioning “street view” in Google maps.

In Historypin’s story section, I provide a brief history of the canal’s impact on the growth of the city.

Then I pose a question. “I wonder if the people in the old photograph still appreciated the canal’s role in creating the city of Rochester, or if they had come to see it as outmoded nuisance which divided the city in half?”

For more ideas for classroom see:  image guide | story guide | teachers’ notes

What I like most about Historypin is that it adds a new dimension to the DBQ approach to instruction – students don’t simply learn from historic documents – they get to document their world for future generations.

More from Historypin:

Historypin was created as part of our current campaign to get people from different generations spending more time together. From a lot testing, we found old photos are a great way of getting people talking about how their street used to look, what their grandparents were like and what’s changed (or not) over time. 

We decided to create a website where people everywhere could share their old photos and the stories behind them, pinning them to a map of the world. We also thought it would be neat if you could compare these old photos with how the world looks today, making the site a bit like a digital time machine. So we asked Google if they’d help. They let us use their map and Street View functionality and helped us build the site. 

The great thing about Historypin is that when they’re using the site, loads of people are spending time with someone from a different generation. Older people have attics full of old photos, younger people know when to click and when to double click.