Mapping Inequality: Exploring Personal History in Redline Maps and the 1940 Census

Designing Inequality

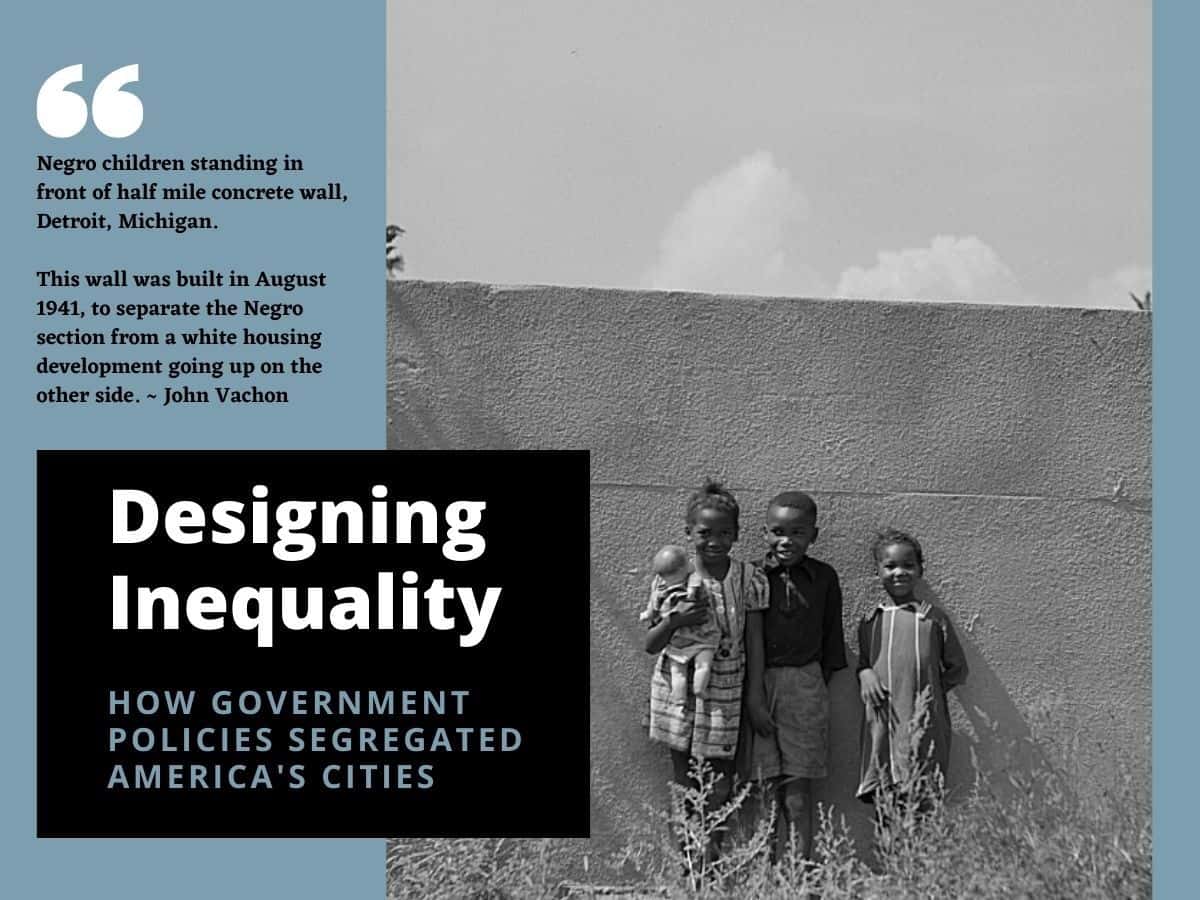
The Detroit Eight Mile Wall is a one-foot-thick , six-foot-high  separation wall that stretches about 12 mile. It was constructed in 1941 to physically separate Black and white homeowners on the sole basis of race. The wall no longer serves to racially segregate homeowners and, as of 1971, both sides of the barrier have been predominately Black. Photo by John Vachon / Library of Congress

This is repost of a lesson I did in my social studies methods class at University of Portland. It explored the largely forgotten government policies that segregated nearly every major American city and metro area. We also looked at how those unconstitutional actions fostered inequality in America since their enactment in the 1930s.

Scroll down for student projects.


In preparation for this class,
students watched the video Segregated by Design.

class session – via Zoom

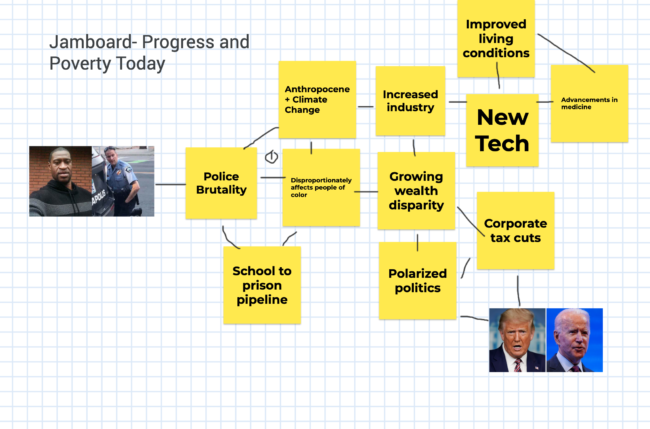
Class opened with the brief film Housing Segregation and Redlining in America: A Short History. I then put students into breakout groups and (using a Jamboard) they created mind maps of the legacy of redlined neighborhoods based on what they had seen in the two introductory videos. They brainstormed and developed visual comparisons that explored multiple factors such as – income, wealth, health, schools, policing, services, employment, environment.

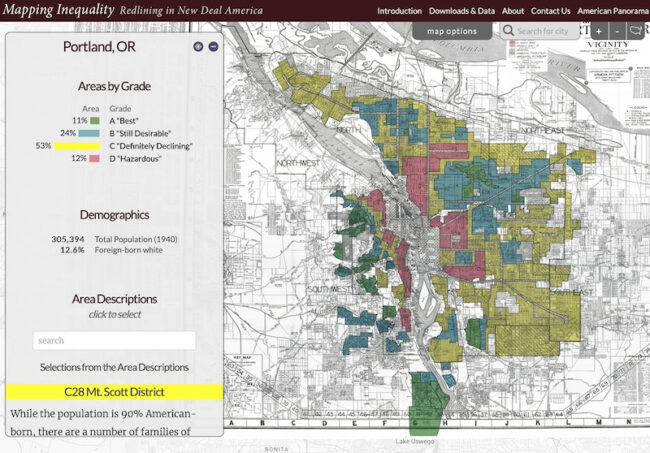
Next I introduced the tools they would use for the lesson – digitized version of  1940 US Census and the website Mapping Inequality: Redlining in New Deal America . Mapping Inequality allows the user to explore the “redline” maps created by agents of the federal government’s Home Owners’ Loan Corporation (HOLC) between 1935 and 1940. The maps are displayed over contemporary maps that make it easy to view where redline districts are today.

HOLC Map of Portland Or See interactive map here.


Next I took them to the the 1940 US Census and showed them how to look up street addresses and navigate to specific neighborhoods. I shared census pages from some Portland neighborhoods.

Sample “Best” and “Hazardous” neighborhoods
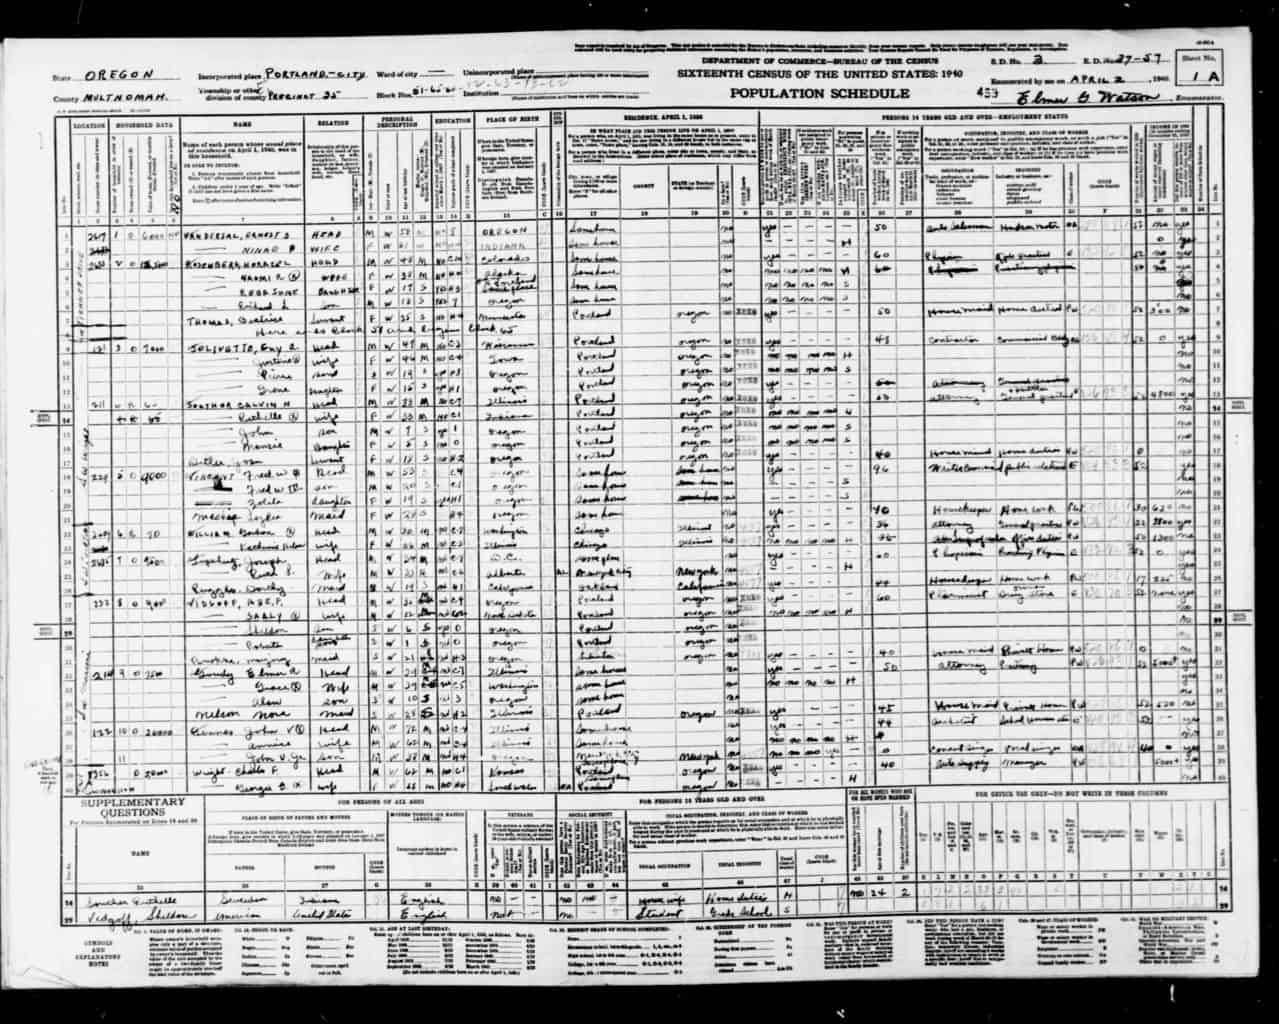
Best” A7 Arlington Heights District- Census page from 229 SW Wright Ave. in A7 | 229 SW Wright Today

Clarifying Remarks from HOLC map: Deed restrictions have expired but single-family residential zoning and topography give ample protection. Infiltration of Subversive Races is remote. Foreign-born families: 0% Negro: none. Residents: Executives, business and professional men, retired capitalists, etc.
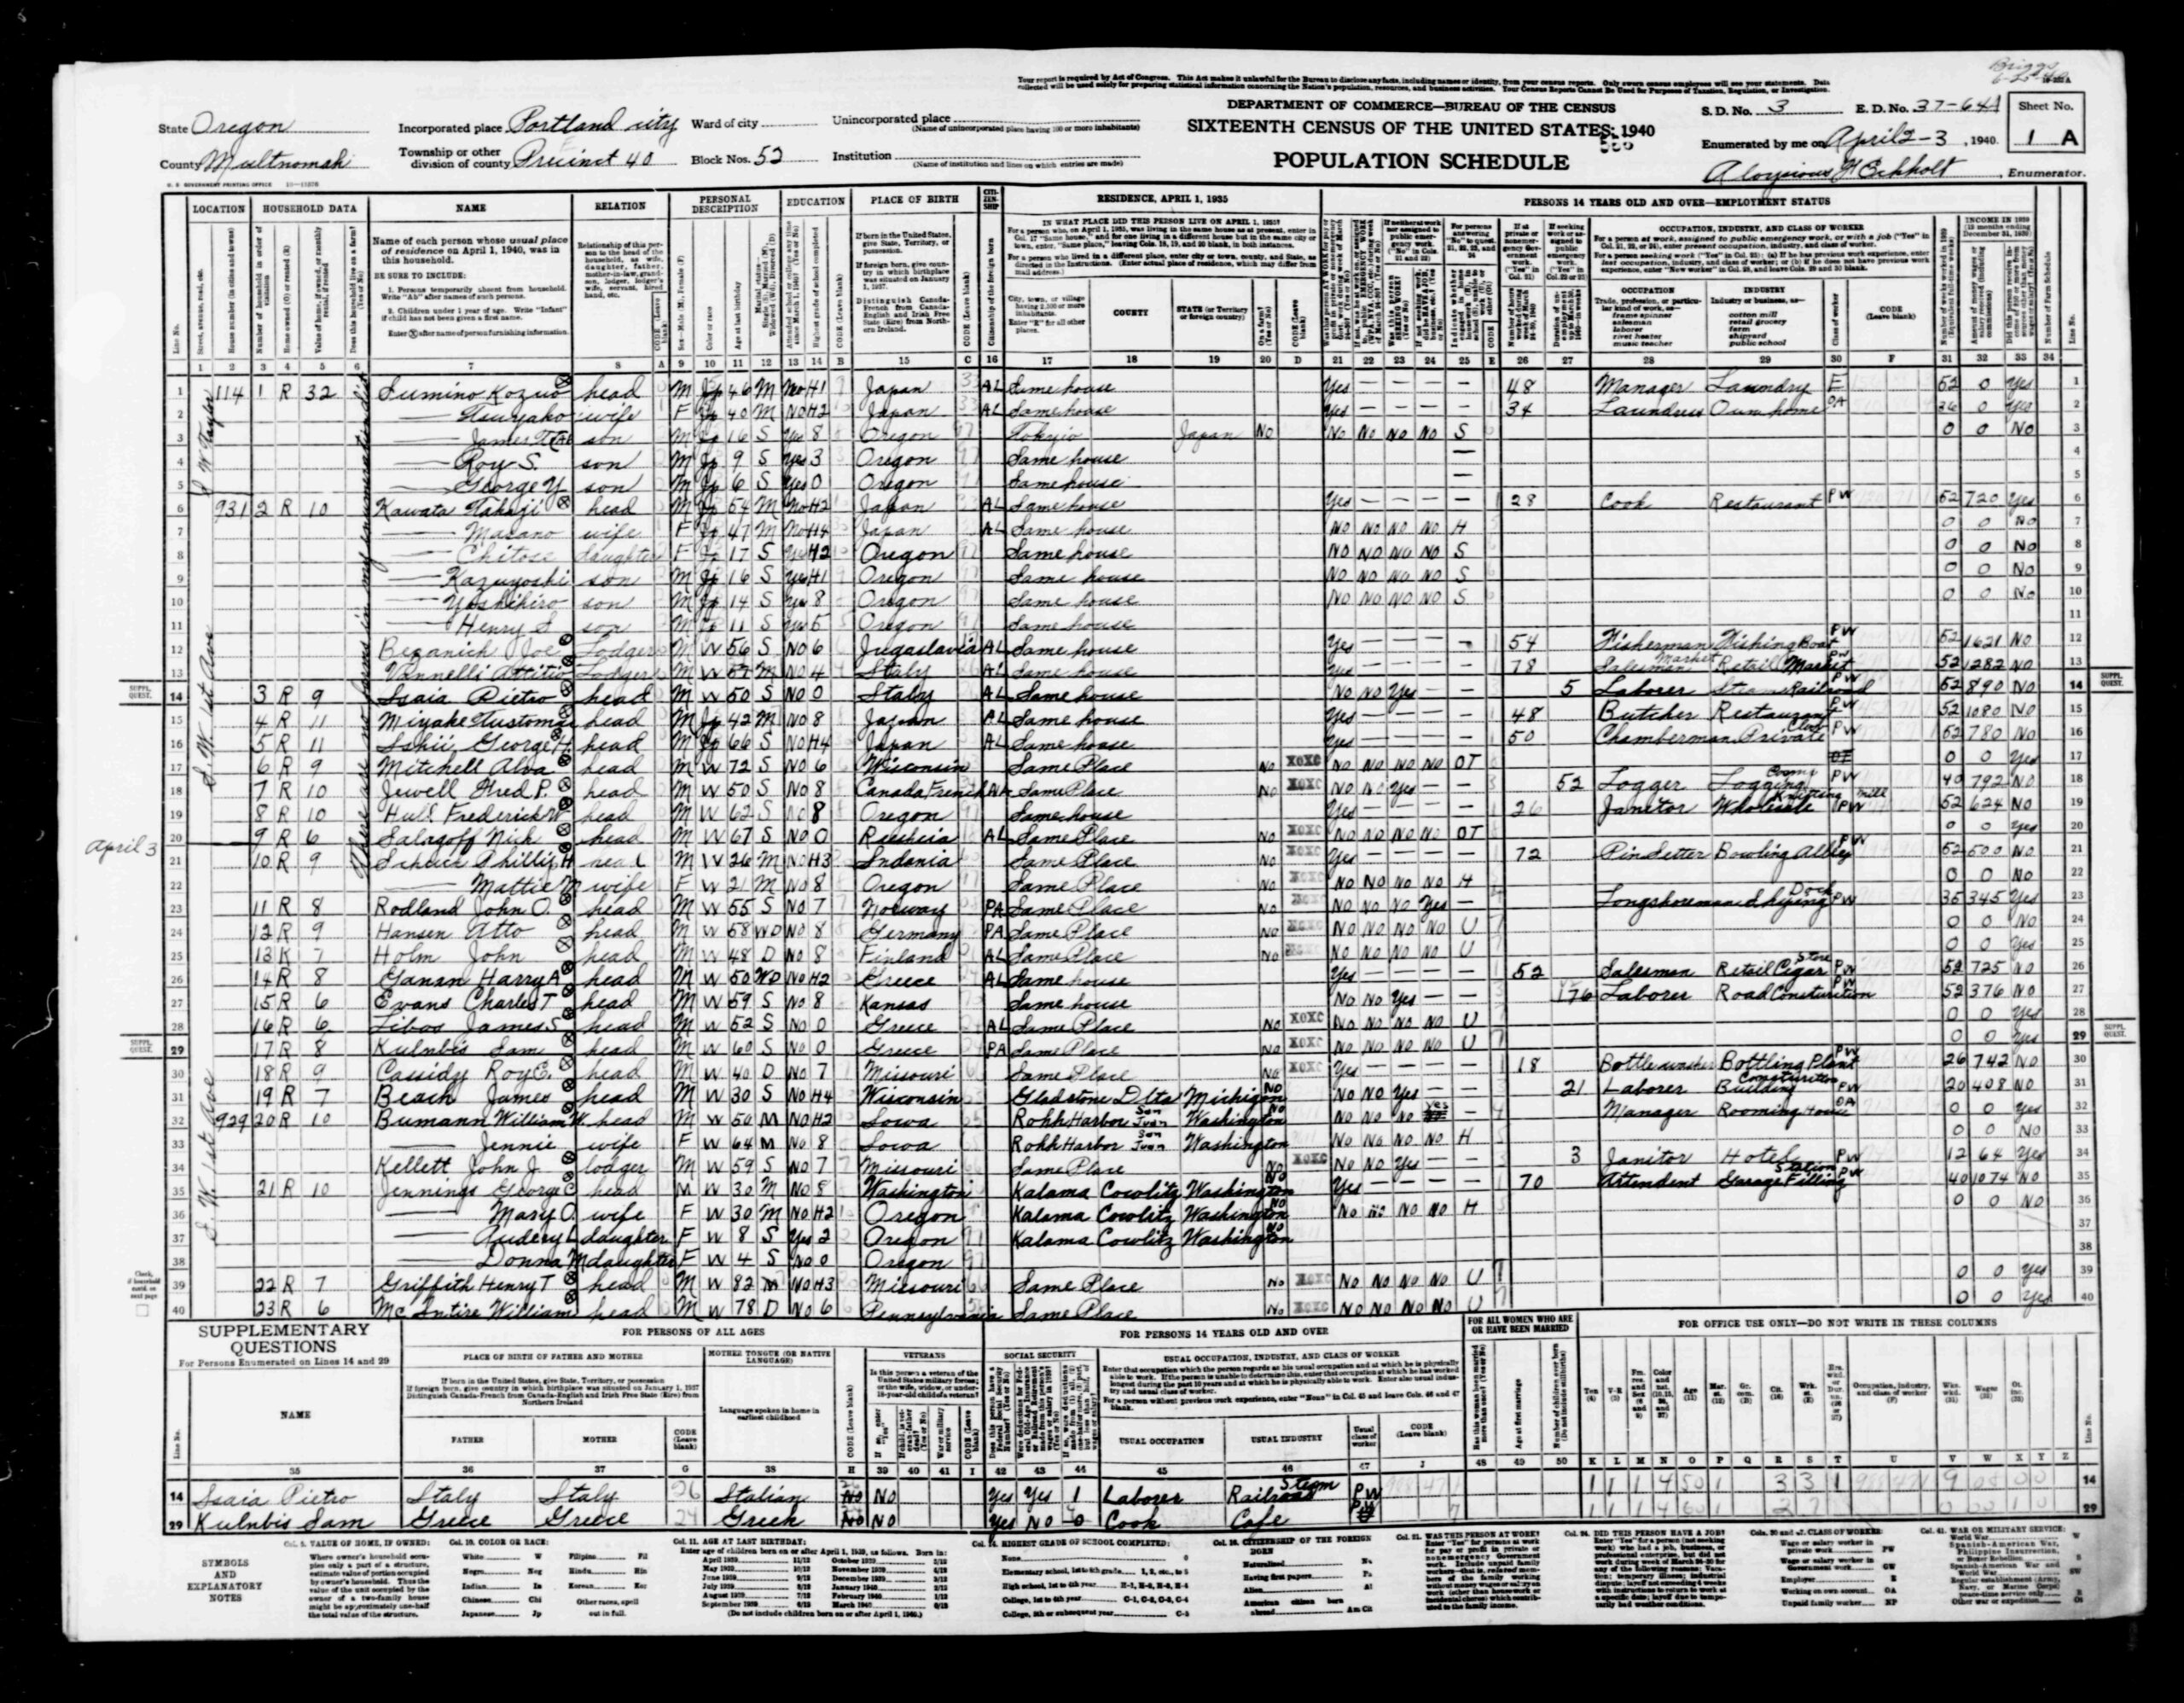

Hazardous” D8 Southwest River District – Census page from 931 SW 1st Ave in Portland in D8. | Rooming house torn down. 931 SW 1st is now the World Trade Center

Clarifying Remarks from HOLC map: This is distinctly a workingmen’s rental district and approximately half of the population being employed in the industrial plants along the river.
Infiltration of Subversive Races has occurred. Foreign-born families 35%; Orientals 750 Chinese, 250 Japanese, 35 Filipinos, Negro 30%


How to search in Census of 1940

Note: it helps to refer to Blank 1940 Census form showing categories

You will “search by location where the person lived.” Begin by narrow search by state, county, city, street. 

After you click search, you have the option to add a cross street. 

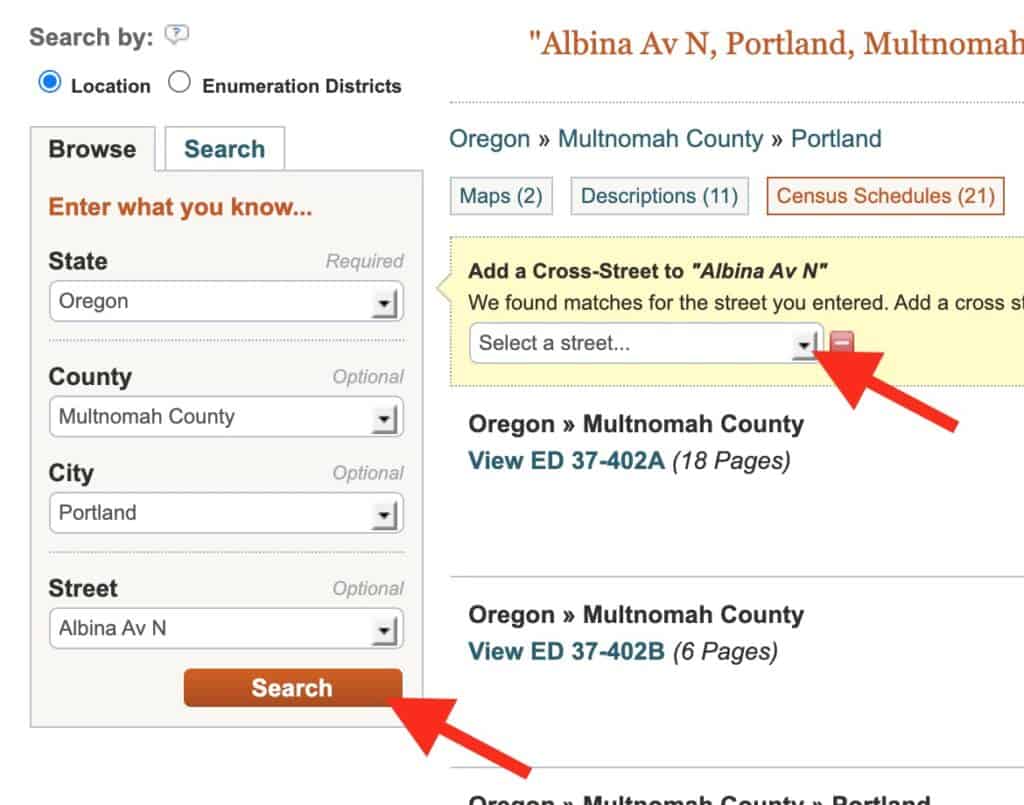
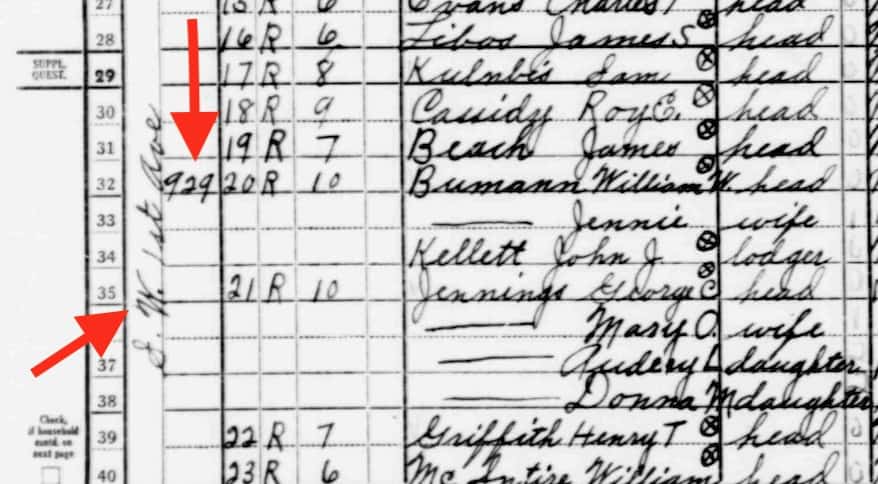
It will take you to multipage document that may not exactly zero in on the intersection you wanted. You may need to scroll through some pages to get to that location. You can find the streets and house numbers on far left. (Street written vertically) 


The assignment

I wanted the student to draw a personal connection between the HOLC categories (best, still desirable, definitely declining and hazardous) and the data from the 1940 census. To demonstrate, I shared my mother’s family entry from 1940 census then showed that my grandparents and family were living in a HOLC designated “Definitely Declining” neighborhood. I shared some family photos of the house and neighborhood. Then we looked at the family home value in 1940 and shared how the neighborhood had steadily declined to the point that the home today is currently valued at less than one-half of the inflation-adjusted value listed in the 1940 census.

I knew that not all students would be able to find a family listing in the census nor might they ever have lived in a city mapped by HOLC. So I left the final product very open ended and invited them to make connections that worked for them.


Sample student work

A number of students were able to find family members on the census and family home in the HOLC maps


A few students focused on the history of homes they lived in.


Some students looked how the HOLC influenced residential options for immigrant groups


Others looked at redlining’s impact on property values and neighborhood development

Teach with Alternative Histories

First off – big shoutout to Jamie Clark – A talented educator to follow on Twitter @XpatEducator. See his collection of Teaching & Learning Resources. (Lots of great free downloadable templates.). I used one of his templates as the basis for this lesson

Here is a repost of the lesson I assigned my University of Portland pre-service teachers. Original here.


In honor of the historic nature of the 2020 election, students will have the opportunity to explore historical turning points and their own creativity by designing an alternative history. Students should have fun with this. It could be set in any era or region of the world. 

You should embed the slide show in a post. Include at least an explanation on why you feel this event was a historical turning point. 

Click here to make a copy and then modify.

Student Work from this assignment.

I got very positive feedback from students who really enjoyed this lesson. They also thought it could be easily expanded so that students had to defend their alt histories. Another ideas was for the teacher to assign everyone the same real events and let students focus on creating and defending their own alt histories.

Here’s a few of the alt histories my students created.


Resources

HOW TO PREPARE YOU GOOGLE SLIDE FOR EMBEDDING ON BLOG POST
  1. Once you have finished slide show. Set Share to “Anyone with a link can view.”
  2. On toolbar click “File/Publish to web.”
  3. Click on embed
  4. Set “auto-advance” to every minute. (That will give viewer chance to navigate.)
  5. Click publish and you will get embed code to use with HTML Snippets.

Featured image by Jon Tyson on Unsplash

Making Connections – Virtual Organizer

I have been teaching my pre-service social studies students historical thinking skills based on the work by Stanford History Education Group. (SHEG). I created – what I call a “Hexagonal Thinking Corroboration Tool” to help them work with corroboration skills. For content we used a selection of documents from the late 19th century curated around the them of rise of industrial America.

I’m sharing the idea to help teachers assist students in making connections. You can easily modify with new content boxes to match your instruction.

Download and copy Keynote file from Google Drive

In my Ed Methods class, students worked remotely in teams to explore the documents in my book, Progress and Poverty in Industrial America (available free at iTunes). Also available online as a Microsoft Sway. We used the 11 sources to create a graphic organizer that responds to the essential question: “How do we evaluate the social costs and benefits of technological innovations?”

  • Image showing "Hexagonal Thinking Corroboration Tool."

They had read all the documents in advance of class. As part of our Zoom class session, I put them in breakout groups and supplied them with a Keynote file “Hexagonal Thinking Corroboration Tool.” Corroboration prompts are from SHEG. This thinking tool was inspired by this post. Keynote design adapted from here.

Instructions:
Work with the members of your breakout group to corroborate the source readings.

  1. Move the source document boxes into spaces on the grid.
  2. Arrange the boxes so you can make connections between two or more source documents.
  3. When you have made an association between two or more documents, move one of numbers to that point
  4. Use the final slide to identify five key connections among the documents.
  5. Corroborate the sources in the connection and create an explanation of what you belief to be the most probable account.

As a final exercise, I supplied them with a Google Jamboard and asked them to evaluate the question “How do we evaluate the social costs and benefits of technological innovations?” in the context of the modern world.

Jamboard showing brainstorm of "Progress and Poverty Today"

Curating Historical Content

Curating Historical Content

Teachers are looking for resources for online instruction. So I am reposting lessons from my Social Studies Methods Course at the University of Portland’s School of Education. See original post here.


Most materials are in the public domain if they were produced before 1923. I see this as roughly equivalent to everything that happened in the world up to and including World War I! If you’re looking for newspaper articles in Chronicling America, for example, you will note that coverage ends in 1922. 

Primary sources produced by the federal government are normally in the public domain both before and after the magic copyright date of 1923. That explains why we as teachers can use the fabulous oral history interviews of former slaves collected between 1936 and 1938 by workers from the Federal Writers’ Project.


Focusing your search using a search operator. [site:loc.gov]

Image Detective Activity (inspired by Crop It lesson)

Being able to find and curate historical source material is a foundation of historical thinking. This activity merges three instructional goals: finding / curating historical sources, looking closely at historical sources and using WordPress tools to add images and hyperlinks. It will help students learn how to find material for future lesson design activities. 

  1. Find 3 historical images – use these historical archive sites
  2. For each image: provide full image with citation in hyperlink back to source
  3. Then add a of crop area of each image to show one of the following clues (add clue in the image caption) Tips on how to crop an image
  4. Put all content into a post. Give it a clever title. Include a featured image.
  • who or what this image is about.
  • where this takes place.
  • when this happened or was created.
  • what is the creator’s point of view or purpose.
  • something I have a question about

Example: Image with two crops

African American Soldiers in an Automobile Source
When? It’s an upside down 1919 NYS license plate.
I think they are returning Black WWI soldiers in a parade.
These Black soldiers are being honored in a parade. Knowing 1919 is in the Jim Crow / KKK era,
I wonder what else faced them back in America?

In class practice images. Choose one. Add to a sample post. Include source hyperlink and crop with comment. 

  1. Smartly dressed couple seated on an 1886-model bicycle for two 1886. Source
  2. The 8th Avenue trolley, NYC, sharing the street with horse-drawn produce wagon and an open automobile 1904 Source
  3. Automobile helped through sandy wash onto mesa 1911. Source
  4. Women’s Machine Gun Squad Police Reserves, New York City 1918 Source
Sample student work from this assignment
Notice some of the fashion choices of these women. For example, all but one of these women have chosen to wear pants rather than skirts. Do you think this was a normal clothing choice for women in the 1920s? Could their outfits be related to the social statement they are making?
This photo of a bakery is taken in 1922.
The languages on sign include Armenian, Ladino, English, Greek and Russian.

Close Reading Historical Documents

Close Reading Historical Documents

Teachers are looking for resources for online instruction. So I am reposting lessons from my Social Studies Methods Course at the University of Portland’s School of Education. See original post here.


Teachers can use historical documents to build literacy skills in a content area while empowering students to be the historian in the classroom. But document-based  instruction in this context requires four key elements to be successful:

  1. The right documents. (shouldn’t be reliant on background knowledge)
  2. Knowing how to “read” the historical document.
  3. Letting students discover their own patterns, then asking students to describe, compare and defend what they found.
  4. Basing the task on enduring questions, the kind that students might actually want to answer.

In Class 7 we will practice some strategies for assisting students to more closely read a document (in all their multimedia formats) by answering three Common Core questions. Broad version:

  1. What does it say?
  2. How does it say it?
  3. What’s it mean to me?

More specifically, what do we mean by close reading? Teachers can guide students with scaffolding questions that explore “texts” (in all their forms).

Key Ideas and Details:

What does the text say? Identify the key ideas. What claims does the author make? What evidence does the author use to support those claims?

Craft and Structure:

Who created the document? What’s their point of view / purpose? How did the text say it? How does it reflect its historic time period?

Integration of Knowledge and ideas

Distinguish among fact, opinion, and reasoned judgment in a text. Recognize disparities between multiple accounts. Compare text to other media / genres. How does it connect to what we’re learning? 

And what’s it mean to me?

IN CLASS ACTIVITY 

Find a historical image and pair it with one of the Primary Source Icebreakers. The post to the padlet below. Include title of icebreaker, response to prompt and hyperlinked source of image. (See example below) These icebreakers are from TPS Connect at MSU Denver.

Source TPS Connect

Made with Padlet
  • target audience
  • content (what will be studied)
  • process (what will you do – what will students do)
  • resources for lessons