First Presidential Debate – Obama, Romney, Lehrer Word Clouds

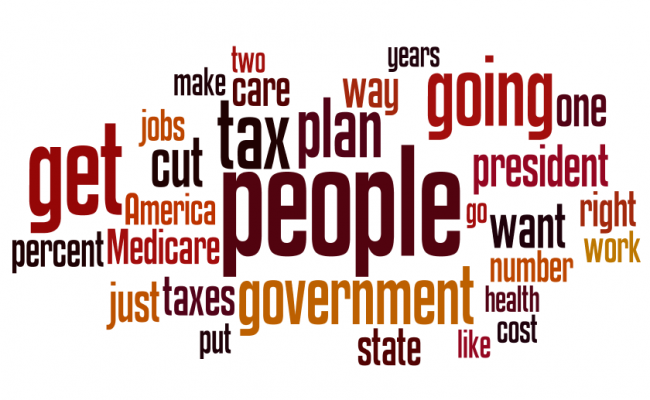
I enjoyed watching the first 2012 Presidential debates. Here’s three word clouds – from President Obama, Governor Romney and debate moderator, Jim Lehrer.

Each word cloud represents the 30 most frequently used words, with the frequency represented by font size. For all three, I removed names and titles from consideration (examples: President Obama, Governor Romney, Jim, Mr. etc). When the term “president” was use to refer to the office, it remained in the count.  Interesting that “47” never turned up.

President Obama

Governor Romney

Jim Lehrer

Transcript source: Washington Post
Word Cloud generation: Wordle.net

Romney vs. Obama Wordle Smackdown

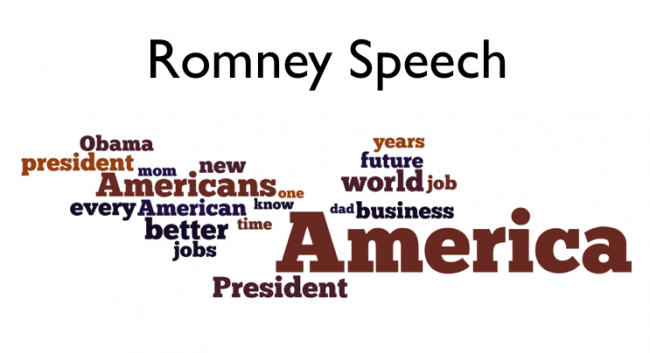
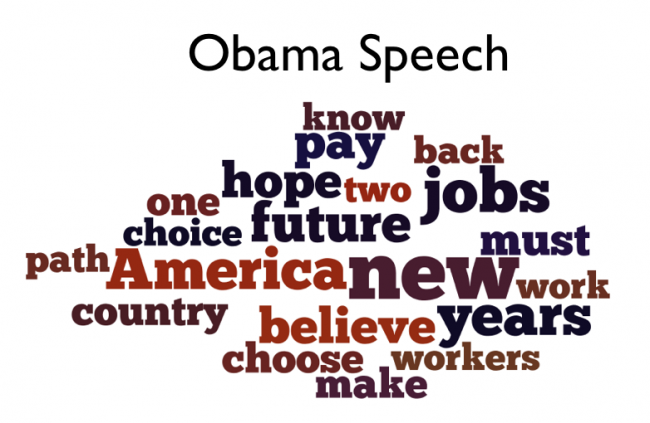
Here’s a Wordle comparison of the top twenty words used in the each candidate’s speech to their conventions. Font size represents frequency that the word appeared in their speech as prepared for delivery. Seems to be “America” vs “new.”

Sources: 
Romney’s Speech to the Republican Convention NY Times
President Obama’s Prepared Remarks From the Democratic National Convention NY Times

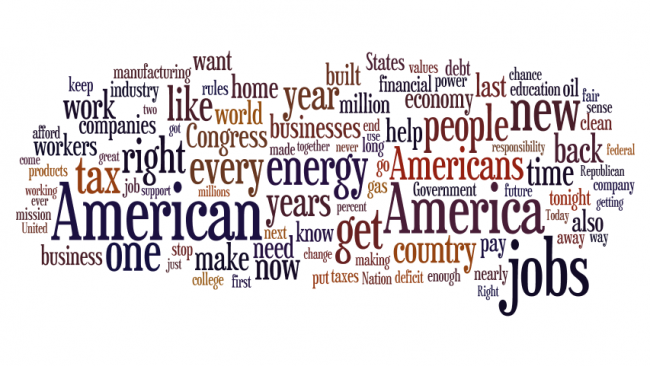
Wordle: Obama’s State of the Union 2012

This Wordle Word Cloud features the 100 most frequently used words from the full text of U.S. President Barack Obama’s 2012 State of the Union address (reported in Wall Street Journal).
Full text

Look carefully and you’ll see “education.”

~~~~~~~~~~~~~~~~~~

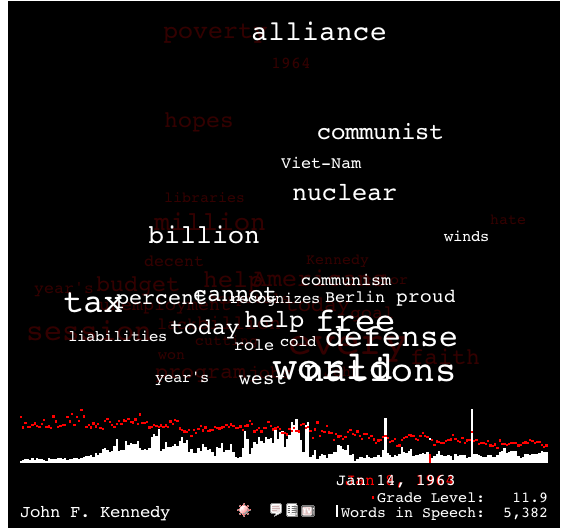
If you want to analyze word use in all the State of the Union addresses, there’s a great tool at State of the Union. Image below is from JFK’s 1961 SOTU. (This a static screen shot go to site for a functional word map.) More instructions below.

Here’s some of the features of this site:

To move between State of the Union addresses, click or drag on the graph below the word cloud; the president who delivered each address and the date of delivery will appear at the bottom of the screen and in the center. The current date will appear in white and the previous one in red.
You can also use the right and left arrow keys to move one year at a time.

The words from the previous address viewed will appear in red when your mouse is over the cloud window so you can compare them. Mouse out to make them fade into the background.

Click on a word to view the full State of the Union address in the window to the right; the selected word will be highlighted.

Click below the graph or on a blank area of the word cloud to view the Wikipedia U.S. History Timeline describing events that happened in and around the year of the address.

How to Use Web 2.0 to Teach Literacy Strategies to Struggling Readers

This week I’m heading out to work with intermediate (grade 4-6) teachers on strategies to assist struggling readers.

We’ll focus on three core skill areas central to the Common Core standards – defining, summarizing and comparing using my guide to 18 Strategies for Struggling Readers. (free PDF file)

Plus I’ll introduce some great websites that they can use with the strategies – the new digital literacy meets the old text literacy.

There are two key elements in each skill area that can help students construct meaning and build background knowledge.

Defining

  • Before the formal definition has been introduced, students should be asked to make connections between their prior knowledge and the term.
  • After the term has been defined, students need activities to more deeply process the term. The focus should be on descriptions, not definitions

Summarizing

  • Students should be asked to make their own judgments about what’s important to them (instead of just repeating the details the teacher highlights).
  • Students will be able to more readily summarize, if they are asked to share what they’ve learned with an audience other than the teacher. They need use a text structure to organize their thinking.

Comparing

  • Students should develop the comparison, not simply repeat the model that we present to them.
  • Student should be asked to share what they learned from the comparison. They need use a text structure to organize their thinking.

I’ve selected some Web 2.0 sites that will enable students to use the strategies in a variety online settings. I’ve picked free sites that have easy learning curves.  For example, we will use One Word to negotiate meaning through images, explore summarizing text structures with Five Card Flickr and design comparisons with Wordle and Books nGram Viewer.

Working with words

  1. Explore word frequency with Wordle
  2. Search published works with Google Books Ngram Viewer
  3. Foster writing skills with One Word writing prompts
  4. Expand vocabulary and word choice with TelescopicText 

Working with words and images

  1. Create mindmaps and graphic organizers with Bubbl.us  
  2. Drag and drop words to create poem based on a photo with Pic-Lits
  3. Foster visual thinking and creative writing with Five Card Flickr

Kid-friendly search sites

  1. SweetSites
  2. Ask Kids

For more ways to use Web 2.0 sites in the classroom
download a free PDF at my post
87 Free Web 2.0 Projects For the K-12 Classroom

Image credit flickr/Mike Licht

How To Quantify Culture? Explore 500 Billion Published Words With Google’s Books Ngram Viewer

By now you must be aware that Google has been busy digitizing books – over 5 million are now available for free download and search. Recently Google Labs has made public a giant database of of names, words and phrases found in those books (along with the years they appeared). It consists of the 500 billion words contained in scanned books published between 1500 and 2008 in English, French, Spanish, German, Chinese and Russian. 

Google Labs has just posted the “Books Ngram Viewer” – a free online research tool that allows you to quickly analyze the frequency of names, words and phrases -and when they appeared in the digitized books. You type in words and / or phrases (separated by comma), set the date range, and click “Search lots of books” – instantly you get the results. Note: when “smoothing” is set to “0” the results will show raw data. Using a higher number produces an average – example “4” will give you four year running averages that will more readily display trends. 

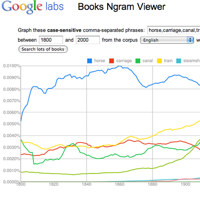
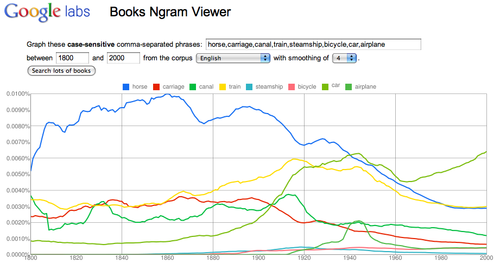
In this graph I searched “horse, carriage, canal, train, steamship, bicycle, car, airplane” and set the date range to 1800 – 2000.  Link to this transport graph at Books Ngram Viewer The results offer some insights into when these new transportation terms found their way into print. 
Transport-1

I think Books Ngram Viewer has many interesting applications in the classroom. The first that comes to mind, is as tool to introduce the research method – form hypothesis, gather and analyze data, revise hypothesis (as needed), draw conclusions, assess research methods. Working in teams students can easily pose research questions, run the data, revise and assess their research strategy. Students can quickly make and test predictions. They can then present and defend their conclusions to other classroom groups. All skills called for by the new Common Core standards.

Using the Ngram viewer, will enable students to discover many insights which will require revisions to their research strategies – a great way to explore word usage, social context and statistics. Words have multiple meanings. In my transport example “car” appears in the graph long before the advent of the automobile. Was it used as railroad car? In contrast to newspapers, events and trends take time to find their way into books. “Pearl Harbor” does not reach a peak until 1945.

The frequency of occurrence scale is important (vertical Y-axis.) If you graph a high frequency word against a low frequency word(s), the low is reduced to a flat line at the base of the scale. (Abraham Lincoln and Marilyn Monroe) Remove the high frequency (Abraham Lincoln) and re-run the graph – the low frequency (Marilyn Monroe) will appear with more detail. 

Need inspiration for nGrams? For a collection of clever searches Click here.

Updates: 

NGram Viewer has added a * wildcard feature. More on how to use it here Hat tip to Jean-Baptiste Michel of the nGram team who emailed me “In English, the data is good in 1800-2000, but not really before or after. Past that date, it looks like the composition of the corpus is changing; trends would indicate a shift in the corpus, not a shift in the underlying culture. So really, one shouldn’t look at data past 2000 in English.”

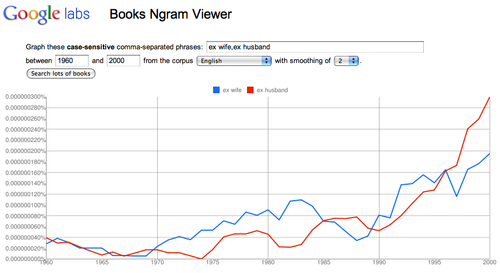
Analyze societal values: “ex wife, ex husband”  
 Changing laws and social values?
Watch the change in the Y-axis scale – add “my ex” to the original graph.
Ex-1

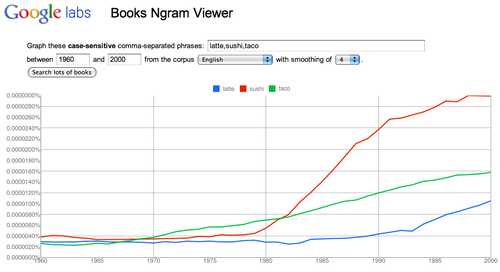
Track trends: “latte, sushi, taco”
Link to graph 
Are these new food fads?
Latte-1