Click here to go the Prezi.
Then click “More” to view full screen. Use arrows at base of Prezi to navigate forward and back through a predefined path. Or use your mouse to explore and zoom the Prezi. Click on hyperlinks in the Prezi to more information about the historic bicycles.
For a PDF version of the Prezi click here.
I’m pleased to have been invited by the educators at the Smithsonian Institution to do a guest blog post using museum resources. It’s a great opportunity to illustrate a question that I often pose to educators – when do we stop modeling for students and free them to take responsibility for their learning? For example, the document-based approach (DBQ) can be a great way for students to “be the historian,” but too often we “over curate” the historic material we share with students. When that happens, the teacher is the active historian and the student is merely a passive recipient of information. For more on that subject see my post: Essential Question: Who is the Teacher in Your Classroom? All across the curriculum, students are told to “analyze” material, but their thinking is constrained by the mandated Venn diagram or T-chart. Developing a comparative schema is messy work – but that’s where the learning takes place. (Hint: letting students do the work is also central the the Common Core standards.) When the student fills out the teacher’s Venn diagram, they aren’t analyzing, they’re filing information into predefined locations.
Of course, students do need proper scaffolding. Opportunities to learn different analytic models – cause / effect, problem / solution, sequencing, continuity / change. It makes sense to provide them some graphic organizers to help master the models. But at some point, you must turn them loose and give them the chance to explore, discover, create. Put another way, if your entire class comes back with the same comparative analysis – you did the thinking, they didn’t.
 I was attracted to the Smithsonian Bicycle collection for two reasons. From an academic perspective, the images of historic bicycles could be analyzed by students without a great deal of background knowledge. My lesson provides a minimum of explanation and gives students more opportunities to develop their own model of how bicycles and bicycle culture evolved over time. On the personal side, much of the year, I live in Portland Oregon – heartland of the urban bike culture. We don’t own a car, but rely on our bikes, walking and public transport. (That’s me with granddaughter Zoe on my Electra Townie bike).
Some of my photographs of contemporary bikes are from Portland, where creative types continue to evolve new designs. I’ve been using Prezi on my blog and in my presentations since it was launched. For many years I’ve been an advocate of the DBQ. This is my first attempt to combine the two.
Step 1: Choosing the Analytic Approach Students need experience using a variety of analytic approaches. Continuity and change is a perspective that has a central role in historic/chronological thinking and it can be used in other disciplines across the curriculum. In this lesson, students are given images of historic bicycles with a minimal amount of supporting text. Starting with concrete observations, students look for patterns of change and continuity (elements that changed, e.g., size / number of wheels, speed, stability and those that remained relatively constant , e.g., human powered, seated posture, need for brakes). Finally, they are asked develop a way to express what they’ve learned. This gives them an audience other than their teacher.
 Step 2: Making It Relevant To make learning relevant and set the stage for self-reflection, students need the opportunity to explore their own approaches. For this reason, I don’t provide a graphic organizer. That would mean that I, not the students, did the analysis. This opened-ended assignment invites students to develop their own graphic or narrative model to express what they’ve learned. Another aspect of relevance is authentic audience and purpose. Therefore I recommend that students be asked to think of how they would share their continuity/change model with younger students.
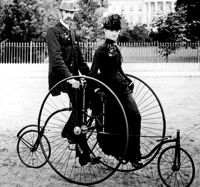
At left: Man astride “1882 Columbia Expert” with son?
Step 3: Making It Rigorous Students should begin by focusing on the lower level comprehension skills (What am I looking at? What materials were used? How were bicycles propelled and steered?) Next they can move to higher level skills.
- Analysis – What patterns do I see in the bicycles – construction, design, features, uses? What elements do they share in common? How do they differ?
- Evaluation – In my own judgment, what elements are changing? Which are staying the same?
- Creating – What have I learned about continuity and change in the history of the bicycle? How can I represent what I’ve learned to share with others? Should I use a graphic organizer? Flow chart? Time line? Diagram? Narrative?
Step 4: Encouraging Students to Reflect On Their Learning Students that have the opportunity to explore their own approaches have a learning experience that can be a basis for reflection. Since they will likely develop different analytic models than their classmates, they have a chance to compare and learn from each others’ conclusions. When asked to develop a way to explain their model to younger peers, students can reflect on how their model suits their audience and purpose. For reflective prompts you can use with your students see my Taxonomy of Reflection.
Step 5: Taking It Further These possible activity extensions can encourage students to think more about bicycles continuity, and change.
- Consider how contemporary bicycles fit your continuity / change model, e.g., recumbent, mountain, fixed gear.
- Design a bicycle
- Apply the continuity / change model in another subject or discipline – fashion, architecture, musical styles, advertising, fictional characters… I could go on, but I hope you see the potential for learning.
- Technology extension – Student could also be invited to view the world’s public photography archives at the Flickr Commons with a search by bicycle.They could help describe the photographs they discover by adding tags or leaving comments. The collection includes works from the Smithsonian and other leading international photographic archives.
Like this:
Like Loading...

 Develop a classification system – analyze patterns, create a schema, evaluate where specific elements belong. Sounds like a very sophisticated exercise. Not really, young toddlers do it all the time – sorting out their toys and household stuff into groups of their own design. They may not be able to explain their thinking, but hand them another item and watch them purposely place it into one of their groups. They have designed a system.