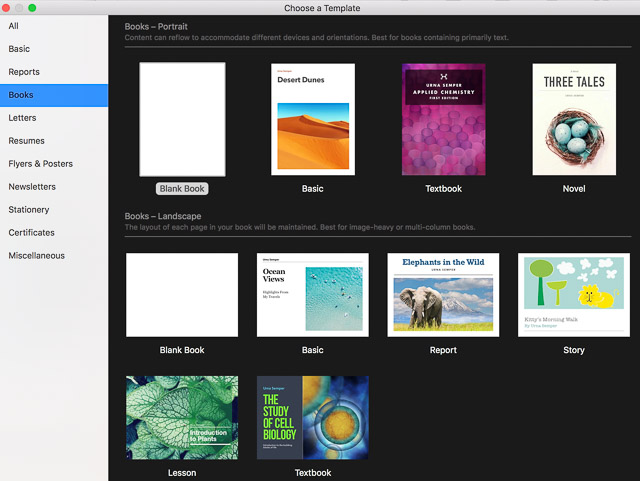
Rather than teaching apps, I taught adaptability. That began with having the courage to be less helpful. At our first class I gave them a simple assignment – create “Tech-Savvy Teacher’s Meme” using Adobe Spark Post and then write a blog post elaborating on your meme in our WordPress site. No one in the class had used either Adobe Spark nor WordPress. No direct instruction from me – I had a created some YouTube video explainers. They had to figure it out themselves. The result – everyone was able to make a cool meme and write their first post on WordPress. They didn’t simply learn a few apps – they learned “I can do this!”
Over the next 14 weeks, we progressed PBL-style through a variety of skills and perspectives. Each class added new tools and perspectives to prior experience – curating public domain content, screencasting, digital storytelling, video production. By the time we got to the end of the course, I had them testing and critiquing apps with no support from me. I would give them three apps designed to perform similar tasks, ask them to work in teams to figure out how to use them, report back to class the pros and cons. And then everyone in the class would choose one app for completing the next assignment – For example – turn a video into a lesson using EdPuzzle, Video Ant, or TEDed.
Laura: I learned that I really need to push myself when it comes to trying new things, because I am capable of much more than I give myself credit for. … a lot of these new tools intimidated me and I was afraid to try them, but once I did, I found it pretty easy to use.
Margaret: I’ve really enjoyed my time in this class this semester. It was definitely one to look forward to in the week, a break from the typical lecture style of other classes. Something I learned about myself during this class is that despite not liking the amount of freedom given to me, I have found ways to create guidelines for myself. … I think with all the things that I have learned during this short amount of time, and the simple pride I got from figuring out how a piece of tech works on my own – I think I will be able to “keep up with the times” with relative ease.
Kiana: Prior to this class I was, admittedly, worried and mildly fearful about utilizing technology so frequently in the classroom. I had very limited knowledge and experience with these types of tools and felt that I would be unable to create products worth sharing with the online world. Although my posts this semester may not be TPT (Teacher Pay Teacher) ready, I was pleasantly surprised with how much content I have created in such a short period of time…. I have already begun to share my knowledge of these “tech tools” with family and friends who are also impressed with how many accessible (free), resources there are.
Dylan: Unlike most classes that follow a specific rubric or have step-by-step instructions, this class and Prof. Pappas, gave us an incredible opportunity to explore new technology, but figure out all the tips and tricks on our own. .. one of the most exciting parts of this class were all the ideas I generated when thinking about what tech tools I now have in my toolbox and ones which I can easily use in lesson and unit plans, as well as on a daily basis with my students. I hope to encourage my students to use technology wisely and to most importantly…be creative with it!v
Nick: Our instructor gave us students just enough background information so that we could wrestle with discovering the technology ourselves. ..He pushed us students to learn for ourselves as he gently guided us alongside. I felt this was a perfect approach to teaching this class as I now feel more prepared to be adaptable and curious to continue learning.
Jordyn: There were also times where I would be using a new app and I just had to figure it out through trial and error. Once I had worked through it for a little while I felt very comfortable using it. Being willing to fail is one of the only ways that we truly learn anything in my opinion.
Melissa: Looking back on that first day of ed tech methods, I felt I was afraid to take that risk and get outside of my comfort zone. I was an advocate for technology, but only ones that were safe, such as SmartBoards or Elmos which are simply advanced versions of projectors and white boards. … While there were many programs I was nervous to use, I was also able to learn new tools which I found my new strengths in.
Bri: I never particularly saw myself as a “tech person” and was a little fearful of whether I would be able to navigate my way around all this new technology. … I am proud of the amount of work I have produced in the short amount of time we have had together and I am proud to say I am not so fearful of exploring new technology that comes my way and I could also potentially see myself implementing these technology tools into my own classroom in the future.
Madison: I learned that stretching myself to learn different things is important in order to become more confident. I learned that although technology is a difficult subject for me, it is good for me to learn new things in order to grow as a person. I am definitely on my way to becoming a “tech-savvy” teacher!
Michael: Overall, it is my opinion that this course was a great success. One of the foundations listed on the class’s website states that the course “leverages a project/problem-based approach,” while another one says that it “…develops critical evaluation skills for assessing what works.” These were both met spectacularly: the course ran using an effective weekly project-based approach that promoted individual critical thinking concerning a wide variety of useful – and sometimes not useful – educational technologies for classroom use.
Lauren: I also learned a few things about myself as a learner too. I learned that I about how much fun teaching can be. All these tech tools take a lot of creativity and flexibility and these were both aspects of myself I needed to work on. Using the Apps we learned about caused me to challenge myself as a more hands on student and future teacher.
Hanna: I saw myself doing things with technology that I had never done before and pushing myself to try new things. I learned that technology is a lot more fun to include in every aspect of the classroom when you are comfortable with it!