By now you must be aware that Google has been busy digitizing books – over 5 million are now available for free download and search. Recently Google Labs has made public a giant database of of names, words and phrases found in those books (along with the years they appeared). It consists of the 500 billion words contained in scanned books published between 1500 and 2008 in English, French, Spanish, German, Chinese and Russian.
Google Labs has just posted the “Books Ngram Viewer” – a free online research tool that allows you to quickly analyze the frequency of names, words and phrases -and when they appeared in the digitized books. You type in words and / or phrases (separated by comma), set the date range, and click “Search lots of books” – instantly you get the results. Note: when “smoothing” is set to “0” the results will show raw data. Using a higher number produces an average – example “4” will give you four year running averages that will more readily display trends.
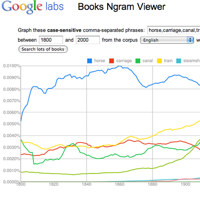
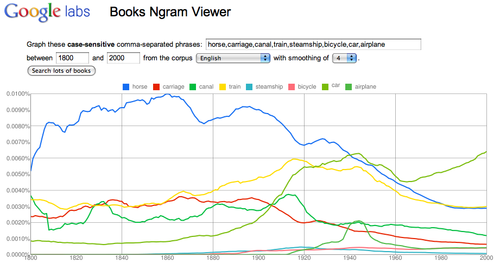
In this graph I searched “horse, carriage, canal, train, steamship, bicycle, car, airplane” and set the date range to 1800 – 2000. Link to this transport graph at Books Ngram Viewer The results offer some insights into when these new transportation terms found their way into print.
I think Books Ngram Viewer has many interesting applications in the classroom. The first that comes to mind, is as tool to introduce the research method – form hypothesis, gather and analyze data, revise hypothesis (as needed), draw conclusions, assess research methods. Working in teams students can easily pose research questions, run the data, revise and assess their research strategy. Students can quickly make and test predictions. They can then present and defend their conclusions to other classroom groups. All skills called for by the new Common Core standards.
Using the Ngram viewer, will enable students to discover many insights which will require revisions to their research strategies – a great way to explore word usage, social context and statistics. Words have multiple meanings. In my transport example “car” appears in the graph long before the advent of the automobile. Was it used as railroad car? In contrast to newspapers, events and trends take time to find their way into books. “Pearl Harbor” does not reach a peak until 1945.
The frequency of occurrence scale is important (vertical Y-axis.) If you graph a high frequency word against a low frequency word(s), the low is reduced to a flat line at the base of the scale. (Abraham Lincoln and Marilyn Monroe) Remove the high frequency (Abraham Lincoln) and re-run the graph – the low frequency (Marilyn Monroe) will appear with more detail.
Need inspiration for nGrams? For a collection of clever searches Click here.
Updates:
NGram Viewer has added a * wildcard feature. More on how to use it here. Hat tip to Jean-Baptiste Michel of the nGram team who emailed me “In English, the data is good in 1800-2000, but not really before or after. Past that date, it looks like the composition of the corpus is changing; trends would indicate a shift in the corpus, not a shift in the underlying culture. So really, one shouldn’t look at data past 2000 in English.”
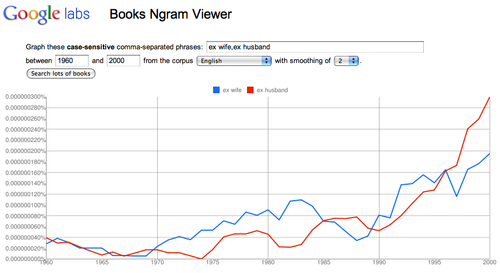
Analyze societal values: “ex wife, ex husband”
Changing laws and social values?
Watch the change in the Y-axis scale – add “my ex” to the original graph.
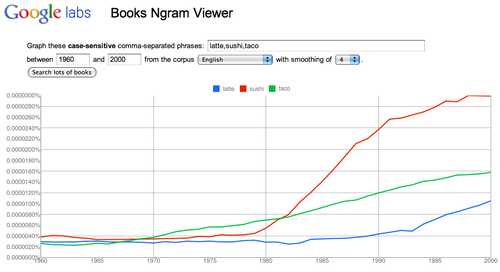
Track trends: “latte, sushi, taco”
Link to graph Are these new food fads?
Like this:
Like Loading...
 This post wraps up my work as guest blogger at the Instructional Technology Strategies Conference 2/20-22, 2011 in Portland, Oregon. It was my first ITSC conference, but it won't be my last. A very impressive line up of facilitators and knowledgeable participants. I'll be back next year! Enjoy the Prezi.
