I’m offering a workshop for educational leaders at AI Empowered EDU conference at the University of Portland on May 14. My session is called “Hands on with AI.”
The site gives tips on how to create prompts, best AI assistants, and sample prompts. The prompt library offers sample prompts useful for students, teacher and educational leaders.
It also includes an excellent how-to videos.
Here’s the workshop agenda.
Are you curious about the potential of artificial intelligence in education? Join our interactive workshop to explore how AI can enhance teaching and learning. Visit the LLMs Page to see suggested AI assistants.
– Hands-On Exploration: Bring your own laptop and dive into practical activities. Collaborate with fellow participants in small groups as we explore AI tools and applications. – Use Cases: Discover real-world examples of AI from the perspective of student, teacher and administrator. You’ll explore prompts and scenarios that improve efficiency, spark creativity and enhance problem-solving. – Tool Showcase: The session will feature custom website that showcases AI tools and methods relevant to education.
Here’s an AI Toolkit that I designed to assist students and teachers with integrating AI into teaching and learning. This is reposted from my course website: EdTechMethods
Since the recent launch of ChatGPT – Artificial intelligence (AI) tools are in the news. Here’s a brief list of AI tools and resources. All are free (or have free intro promotions). We will be integrating them into our course over the semester.
OUr Course AI Policy
You are free to use AI tools in this course for your weekly assignments. Some assignments – like this week’s – will require it. You are free to use AI in creative ways. But be sure to always site AI use as noted in #1 below. See my example at the end of this page.
Be aware of the limits of ChatGPT and other text generating apps:
AI is a tool, but one that you need to acknowledge using. Please include a paragraph at the end of any assignment that uses AI explaining what you used AI for and what prompts you used to get the results. Failure to do so is in violation of academic honesty policies.
If you provide minimum effort prompts, you will get low quality results.
You will need to refine your prompts in order to get good outcomes. This will take work.
Don’t trust anything it says. If it gives you a number or fact, assume it is wrong unless you either know the answer or can check in with another source. You will be responsible for any errors or omissions provided by the tool. It works best for topics you understand.
Be thoughtful about when this tool is useful. Don’t use it if it isn’t appropriate for the case or circumstance.
AI is a tool. It is not always the right tool. Consider carefully whether, given its weaknesses, it is right for the purpose to which you are planning to apply it.
There are many ethical concerns you need to be aware of. AI can be used to infringe on copyright, or to cheat, or to steal the work of others, or to manipulate. And how a particular AI model is built and who benefits from its use are often complex issues, and not particularly clear at this stage. Ultimately, you are responsible for using these tools in an ethical manner. Be transparent about how you use AI, and take responsibility for the output you create ~ adapted from Ethan Mollick
Perplexity | LinkBetter at looking information up than generating new ideas. But shows sources and lets you edit them out or add new sources. [Click 3 dots in upper right of the response.]
AI note for this page: I elected to use AI to generate a featured image for this page. Thought it would be proof of concept. I used Lexica and this prompt: “A steampunk tool box in a mysterious setting.” It took me a number of tries to add descriptor prompts to get something I wanted.The final image included some elements that make no sense – what’s the “screen” at right and cables in foreground? Mysterious?
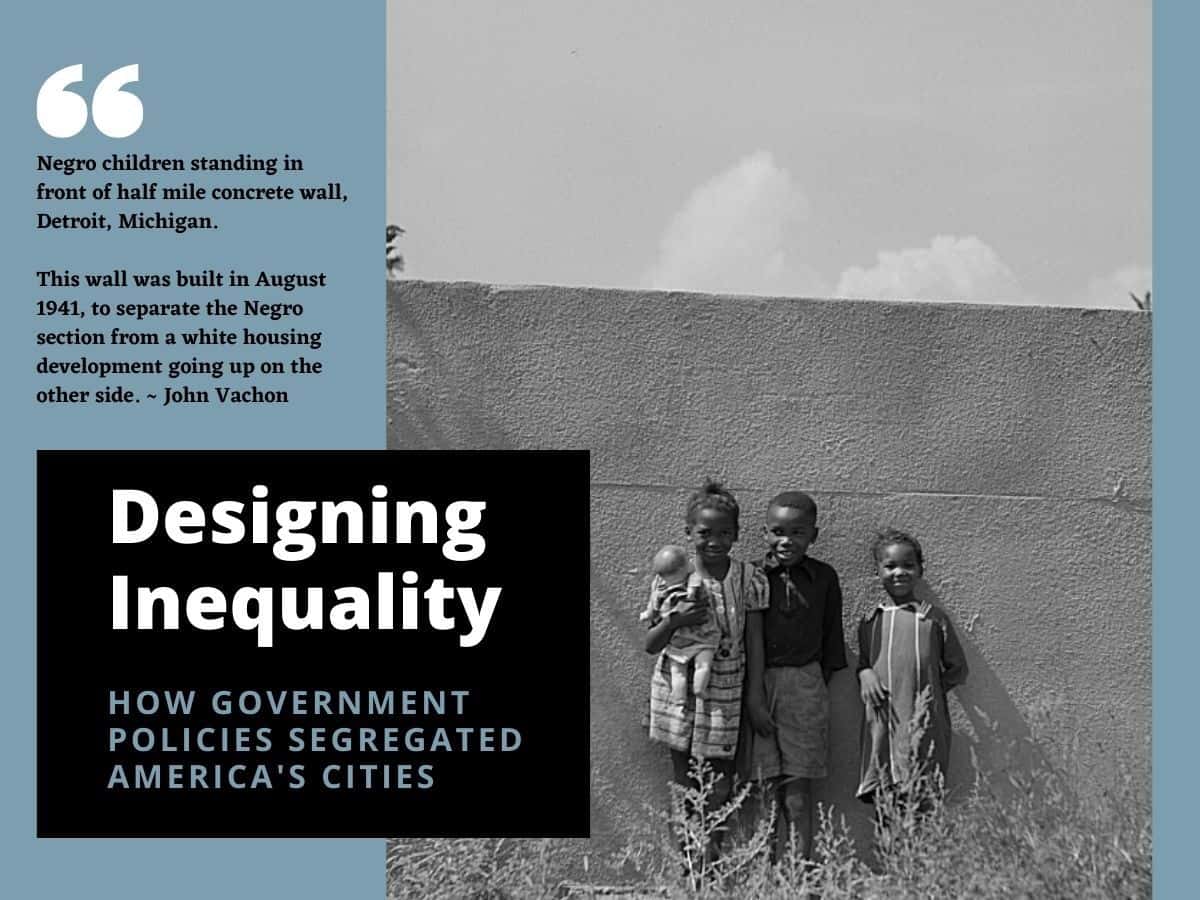
The Detroit Eight Mile Wall is a one-foot-thick , six-foot-high separation wall that stretches about 1⁄2 mile. It was constructed in 1941 to physically separate Black and white homeowners on the sole basis of race. The wall no longer serves to racially segregate homeowners and, as of 1971, both sides of the barrier have been predominately Black. Photo by John Vachon / Library of Congress
This is repost of a lesson I did in my social studies methods class at University of Portland. It explored the largely forgotten government policies that segregated nearly every major American city and metro area. We also looked at how those unconstitutional actions fostered inequality in America since their enactment in the 1930s.
Class opened with the brief film Housing Segregation and Redlining in America: A Short History. I then put students into breakout groups and (using a Jamboard) they created mind maps of the legacy of redlined neighborhoods based on what they had seen in the two introductory videos. They brainstormed and developed visual comparisons that explored multiple factors such as – income, wealth, health, schools, policing, services, employment, environment.
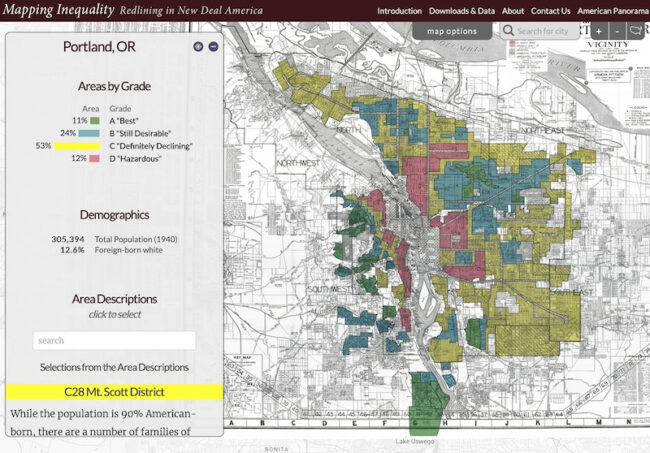
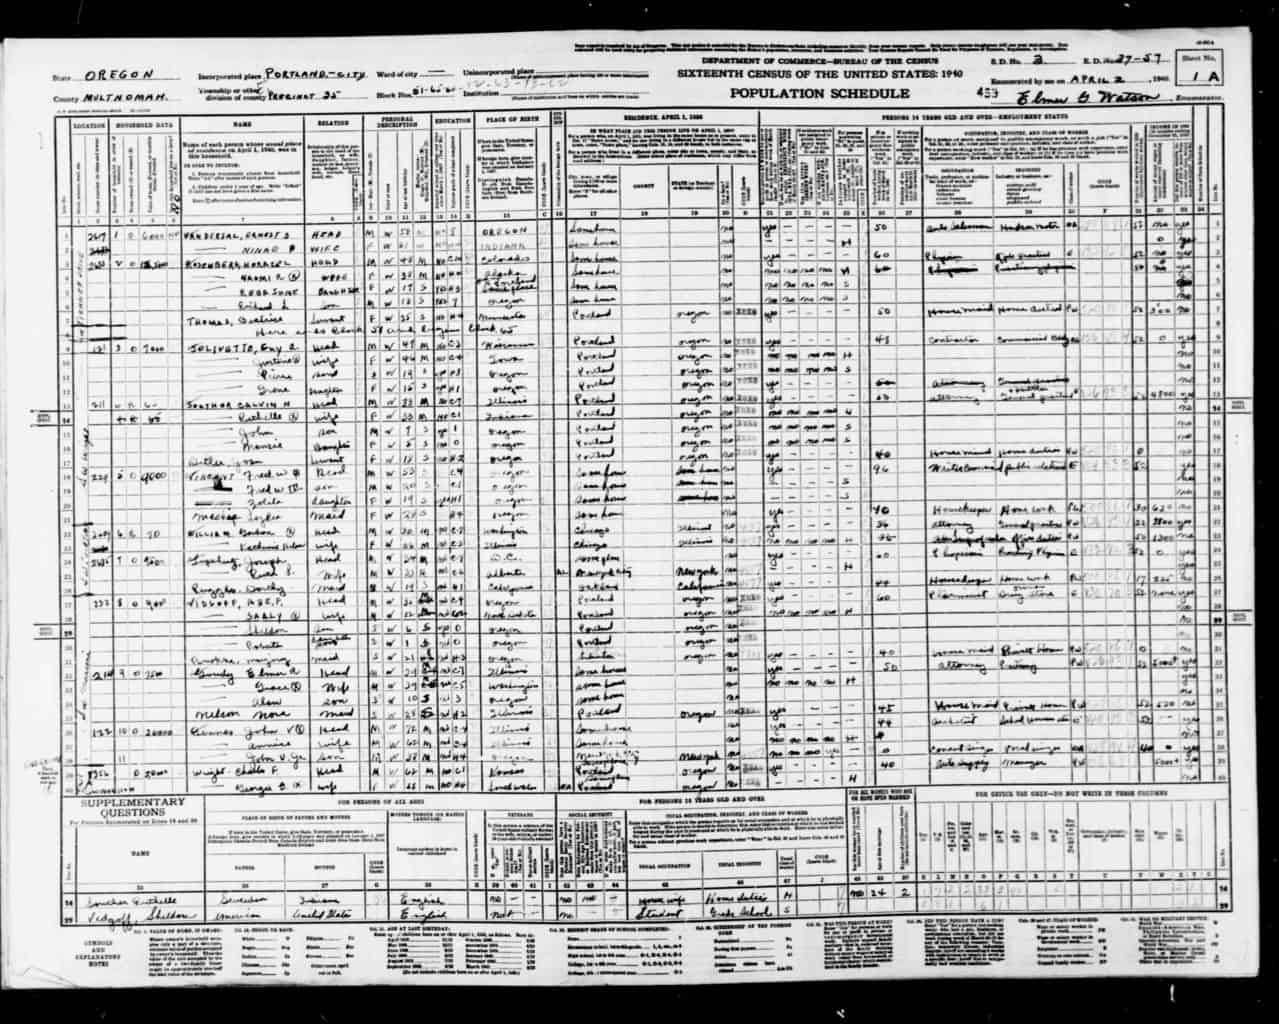
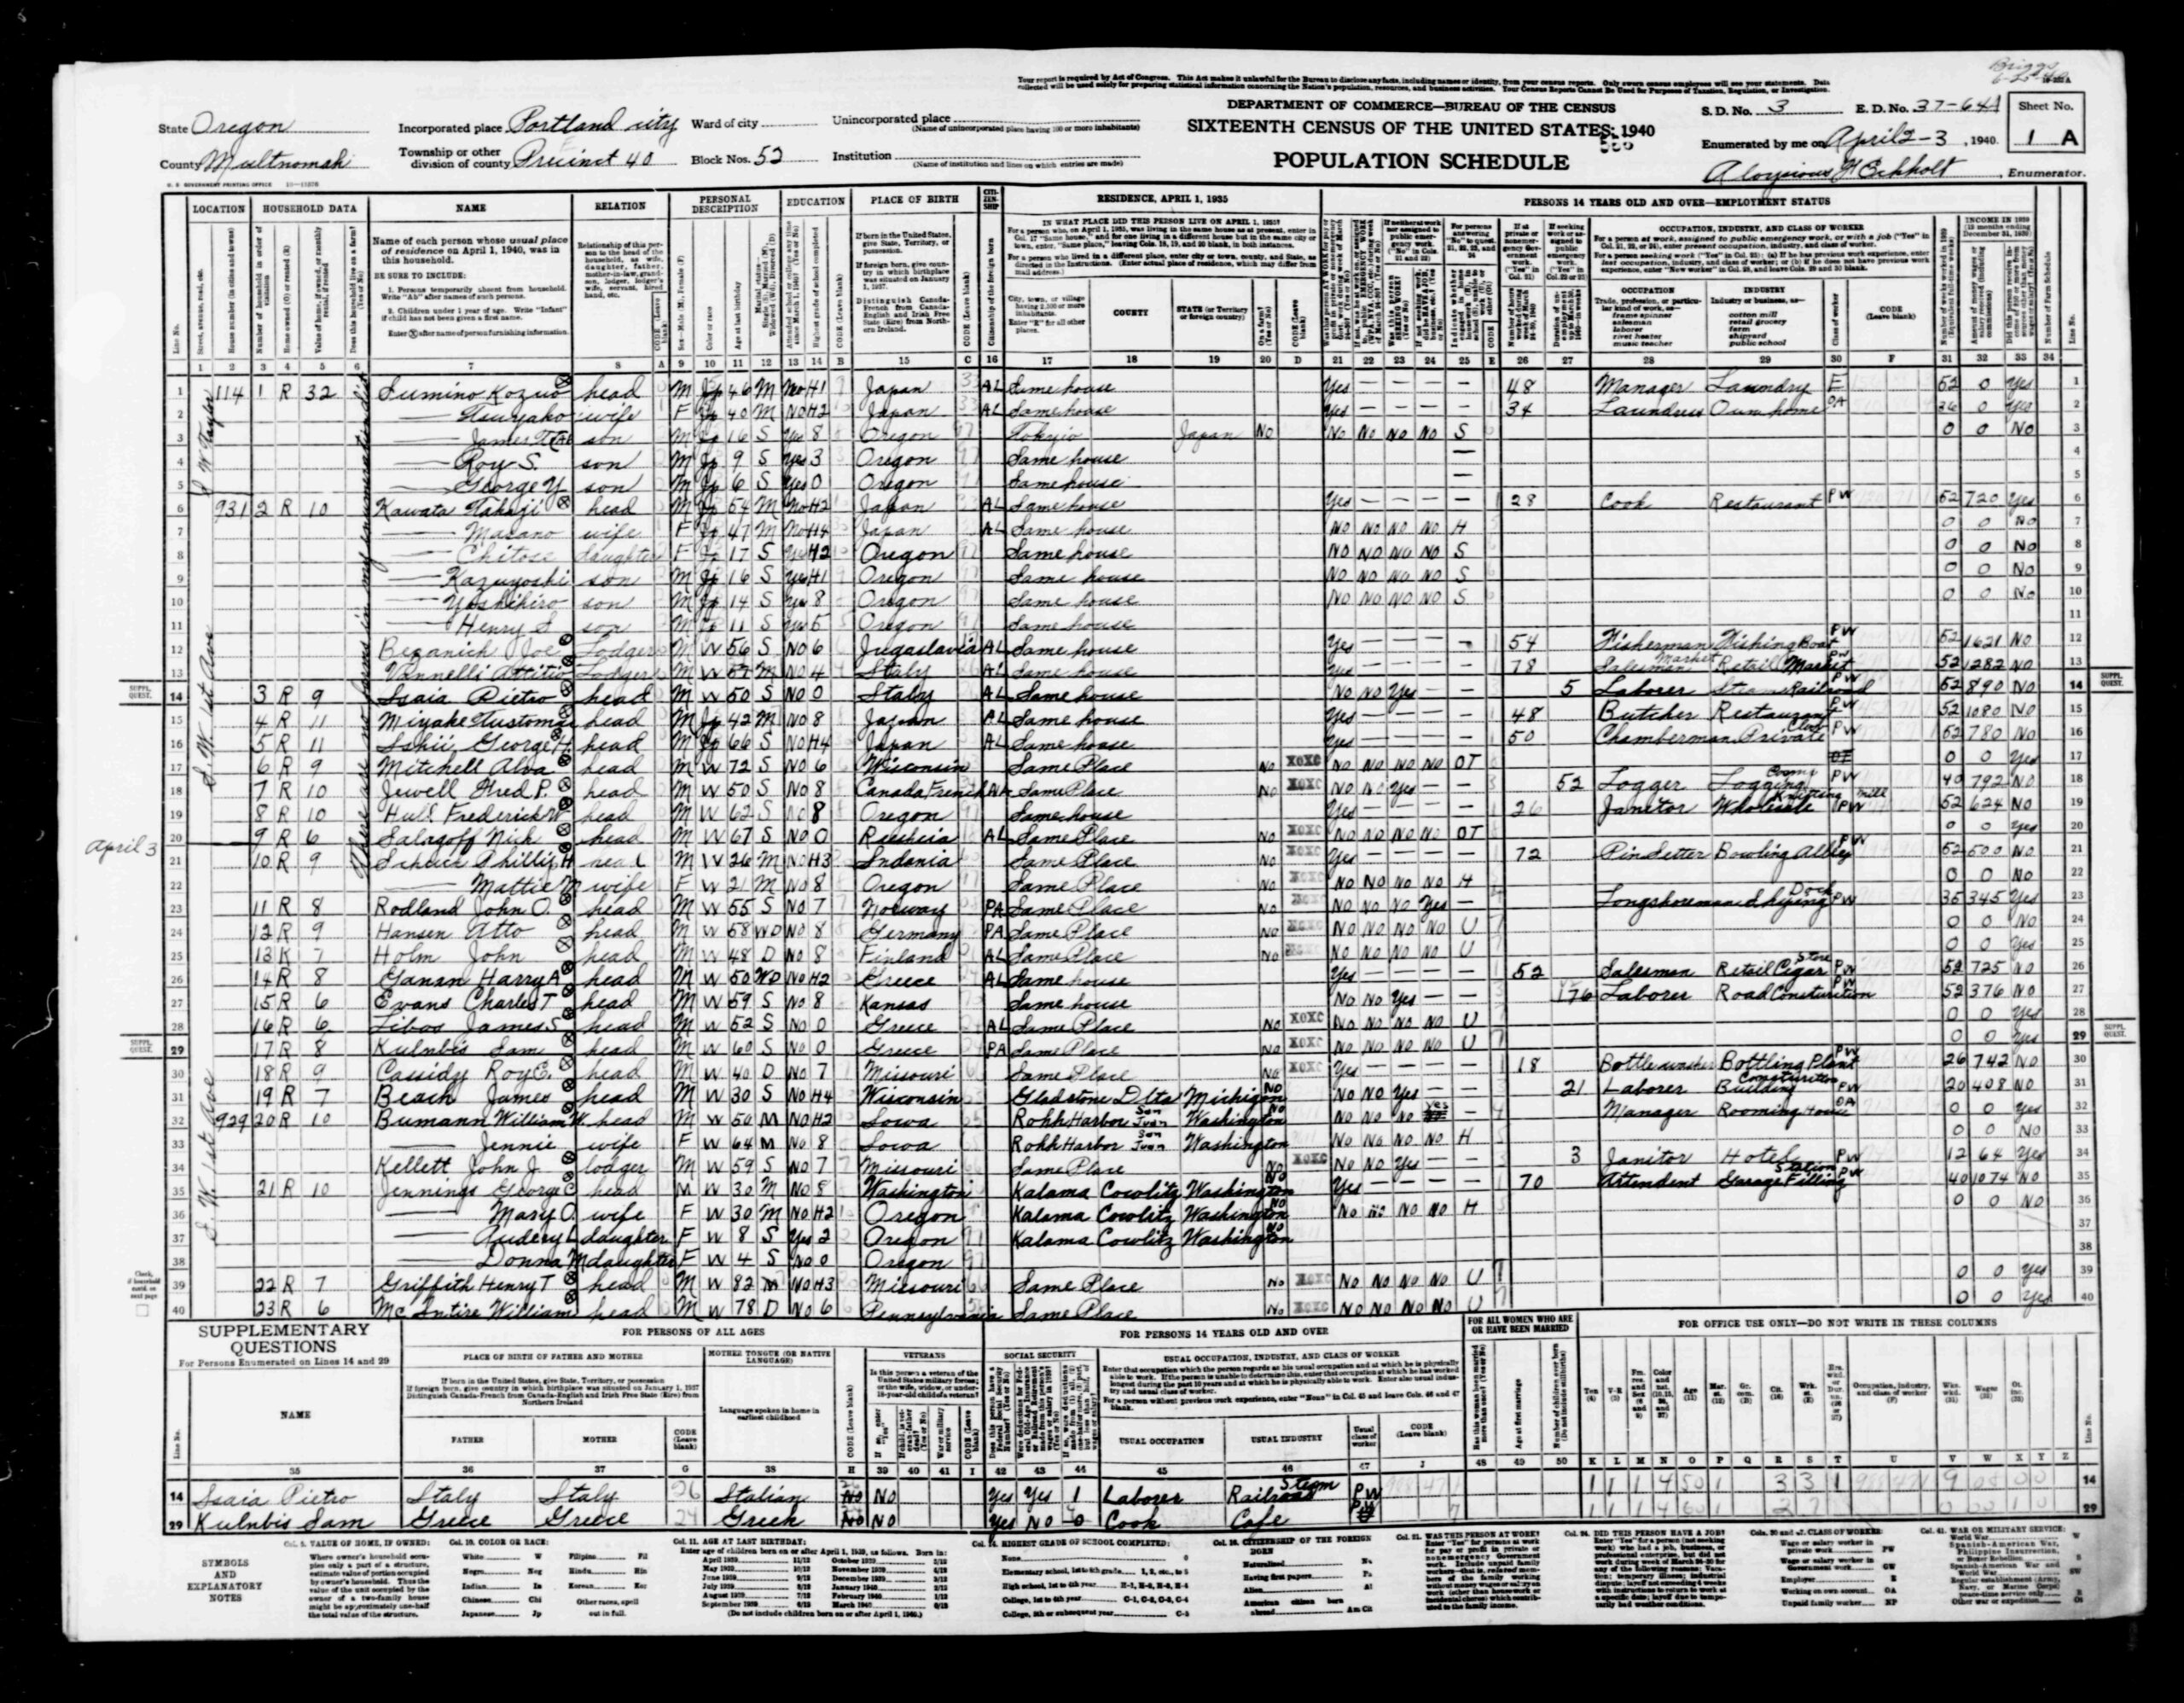
Next I introduced the tools they would use for the lesson – digitized version of 1940 US Census and the website Mapping Inequality: Redlining in New Deal America . Mapping Inequality allows the user to explore the “redline” maps created by agents of the federal government’s Home Owners’ Loan Corporation (HOLC) between 1935 and 1940. The maps are displayed over contemporary maps that make it easy to view where redline districts are today.
Next I took them to the the 1940 US Census and showed them how to look up street addresses and navigate to specific neighborhoods. I shared census pages from some Portland neighborhoods.
Clarifying Remarks from HOLC map: Deed restrictions have expired but single-family residential zoning and topography give ample protection. Infiltration of Subversive Races is remote. Foreign-born families: 0% Negro: none. Residents: Executives, business and professional men, retired capitalists, etc.
Clarifying Remarksfrom HOLC map: This is distinctly a workingmen’s rental district and approximately half of the population being employed in the industrial plants along the river. Infiltration of Subversive Races has occurred. Foreign-born families 35%; Orientals 750 Chinese, 250 Japanese, 35 Filipinos, Negro 30%
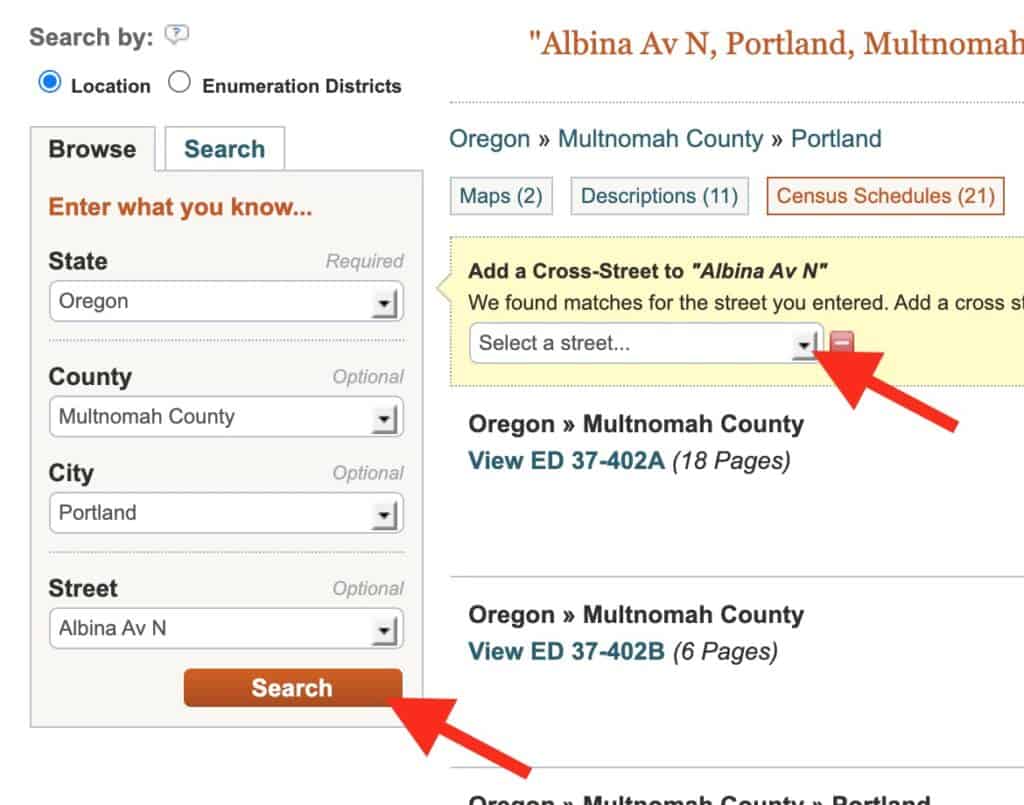
You will “search by location where the person lived.” Begin by narrow search by state, county, city, street.
After you click search, you have the option to add a cross street.
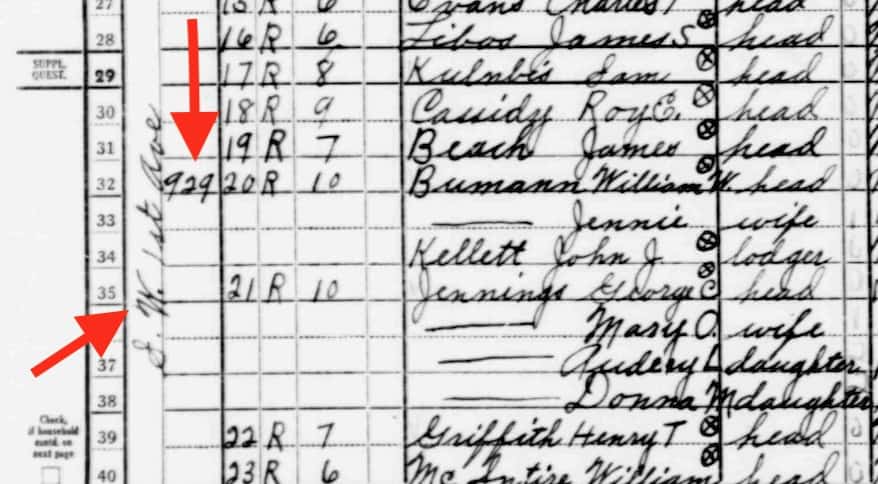
It will take you to multipage document that may not exactly zero in on the intersection you wanted. You may need to scroll through some pages to get to that location. You can find the streets and house numbers on far left. (Street written vertically)
The assignment
I wanted the student to draw a personal connection between the HOLC categories (best, still desirable, definitely declining and hazardous) and the data from the 1940 census. To demonstrate, I shared my mother’s family entry from 1940 census then showed that my grandparents and family were living in a HOLC designated “Definitely Declining” neighborhood. I shared some family photos of the house and neighborhood. Then we looked at the family home value in 1940 and shared how the neighborhood had steadily declined to the point that the home today is currently valued at less than one-half of the inflation-adjusted value listed in the 1940 census.
I knew that not all students would be able to find a family listing in the census nor might they ever have lived in a city mapped by HOLC. So I left the final product very open ended and invited them to make connections that worked for them.
Sample student work
A number of students were able to find family members on the census and family home in the HOLC maps
I have been teaching my pre-service social studies students historical thinking skills based on the work by Stanford History Education Group. (SHEG). I created – what I call a “Hexagonal Thinking Corroboration Tool” to help them work with corroboration skills. For content we used a selection of documents from the late 19th century curated around the them of rise of industrial America.
I’m sharing the idea to help teachers assist students in making connections. You can easily modify with new content boxes to match your instruction.
In my Ed Methods class, students worked remotely in teams to explore the documents in my book, Progress and Poverty in Industrial America (available free at iTunes). Also available online as a Microsoft Sway. We used the 11 sources to create a graphic organizer that responds to the essential question: “How do we evaluate the social costs and benefits of technological innovations?”
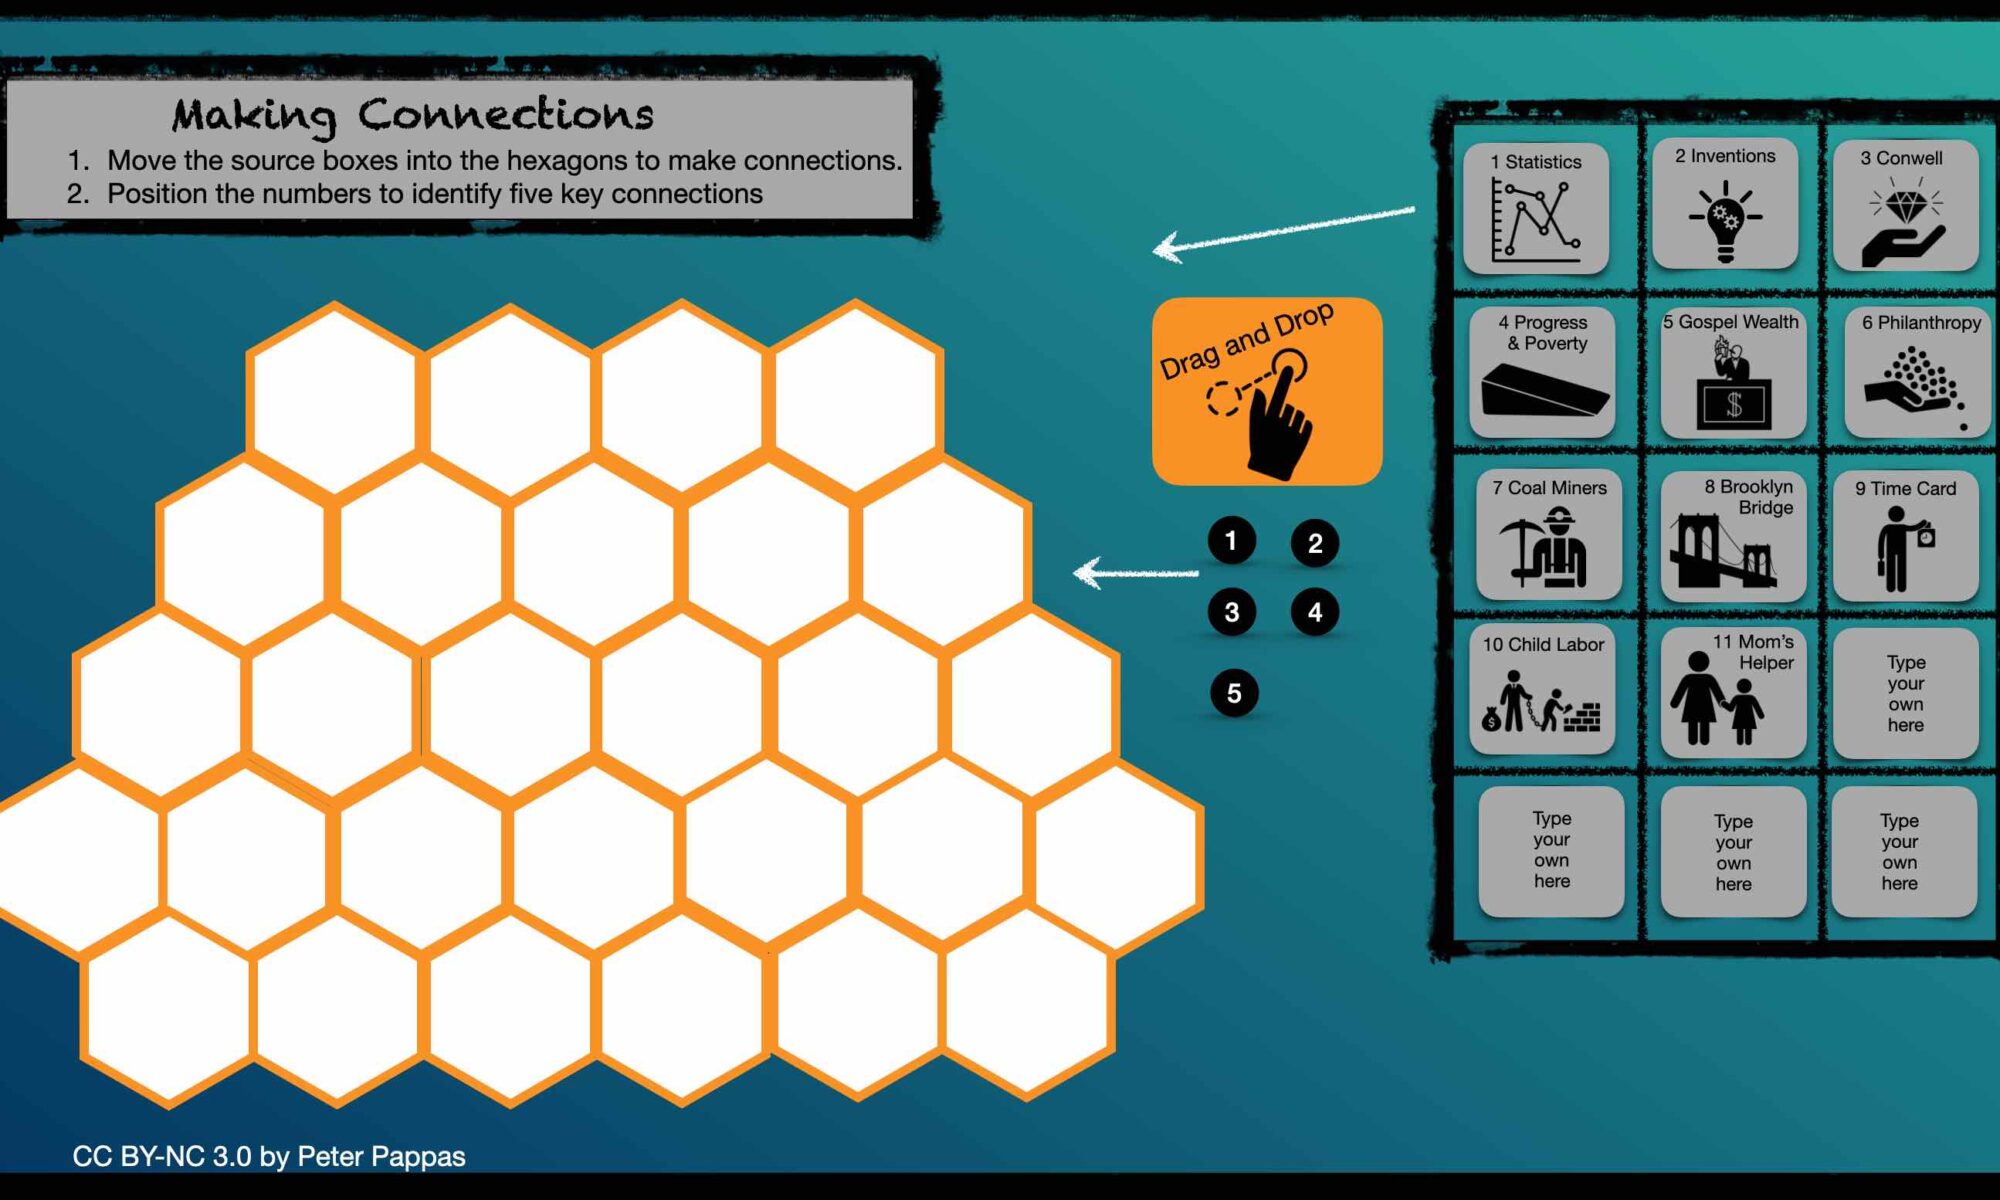
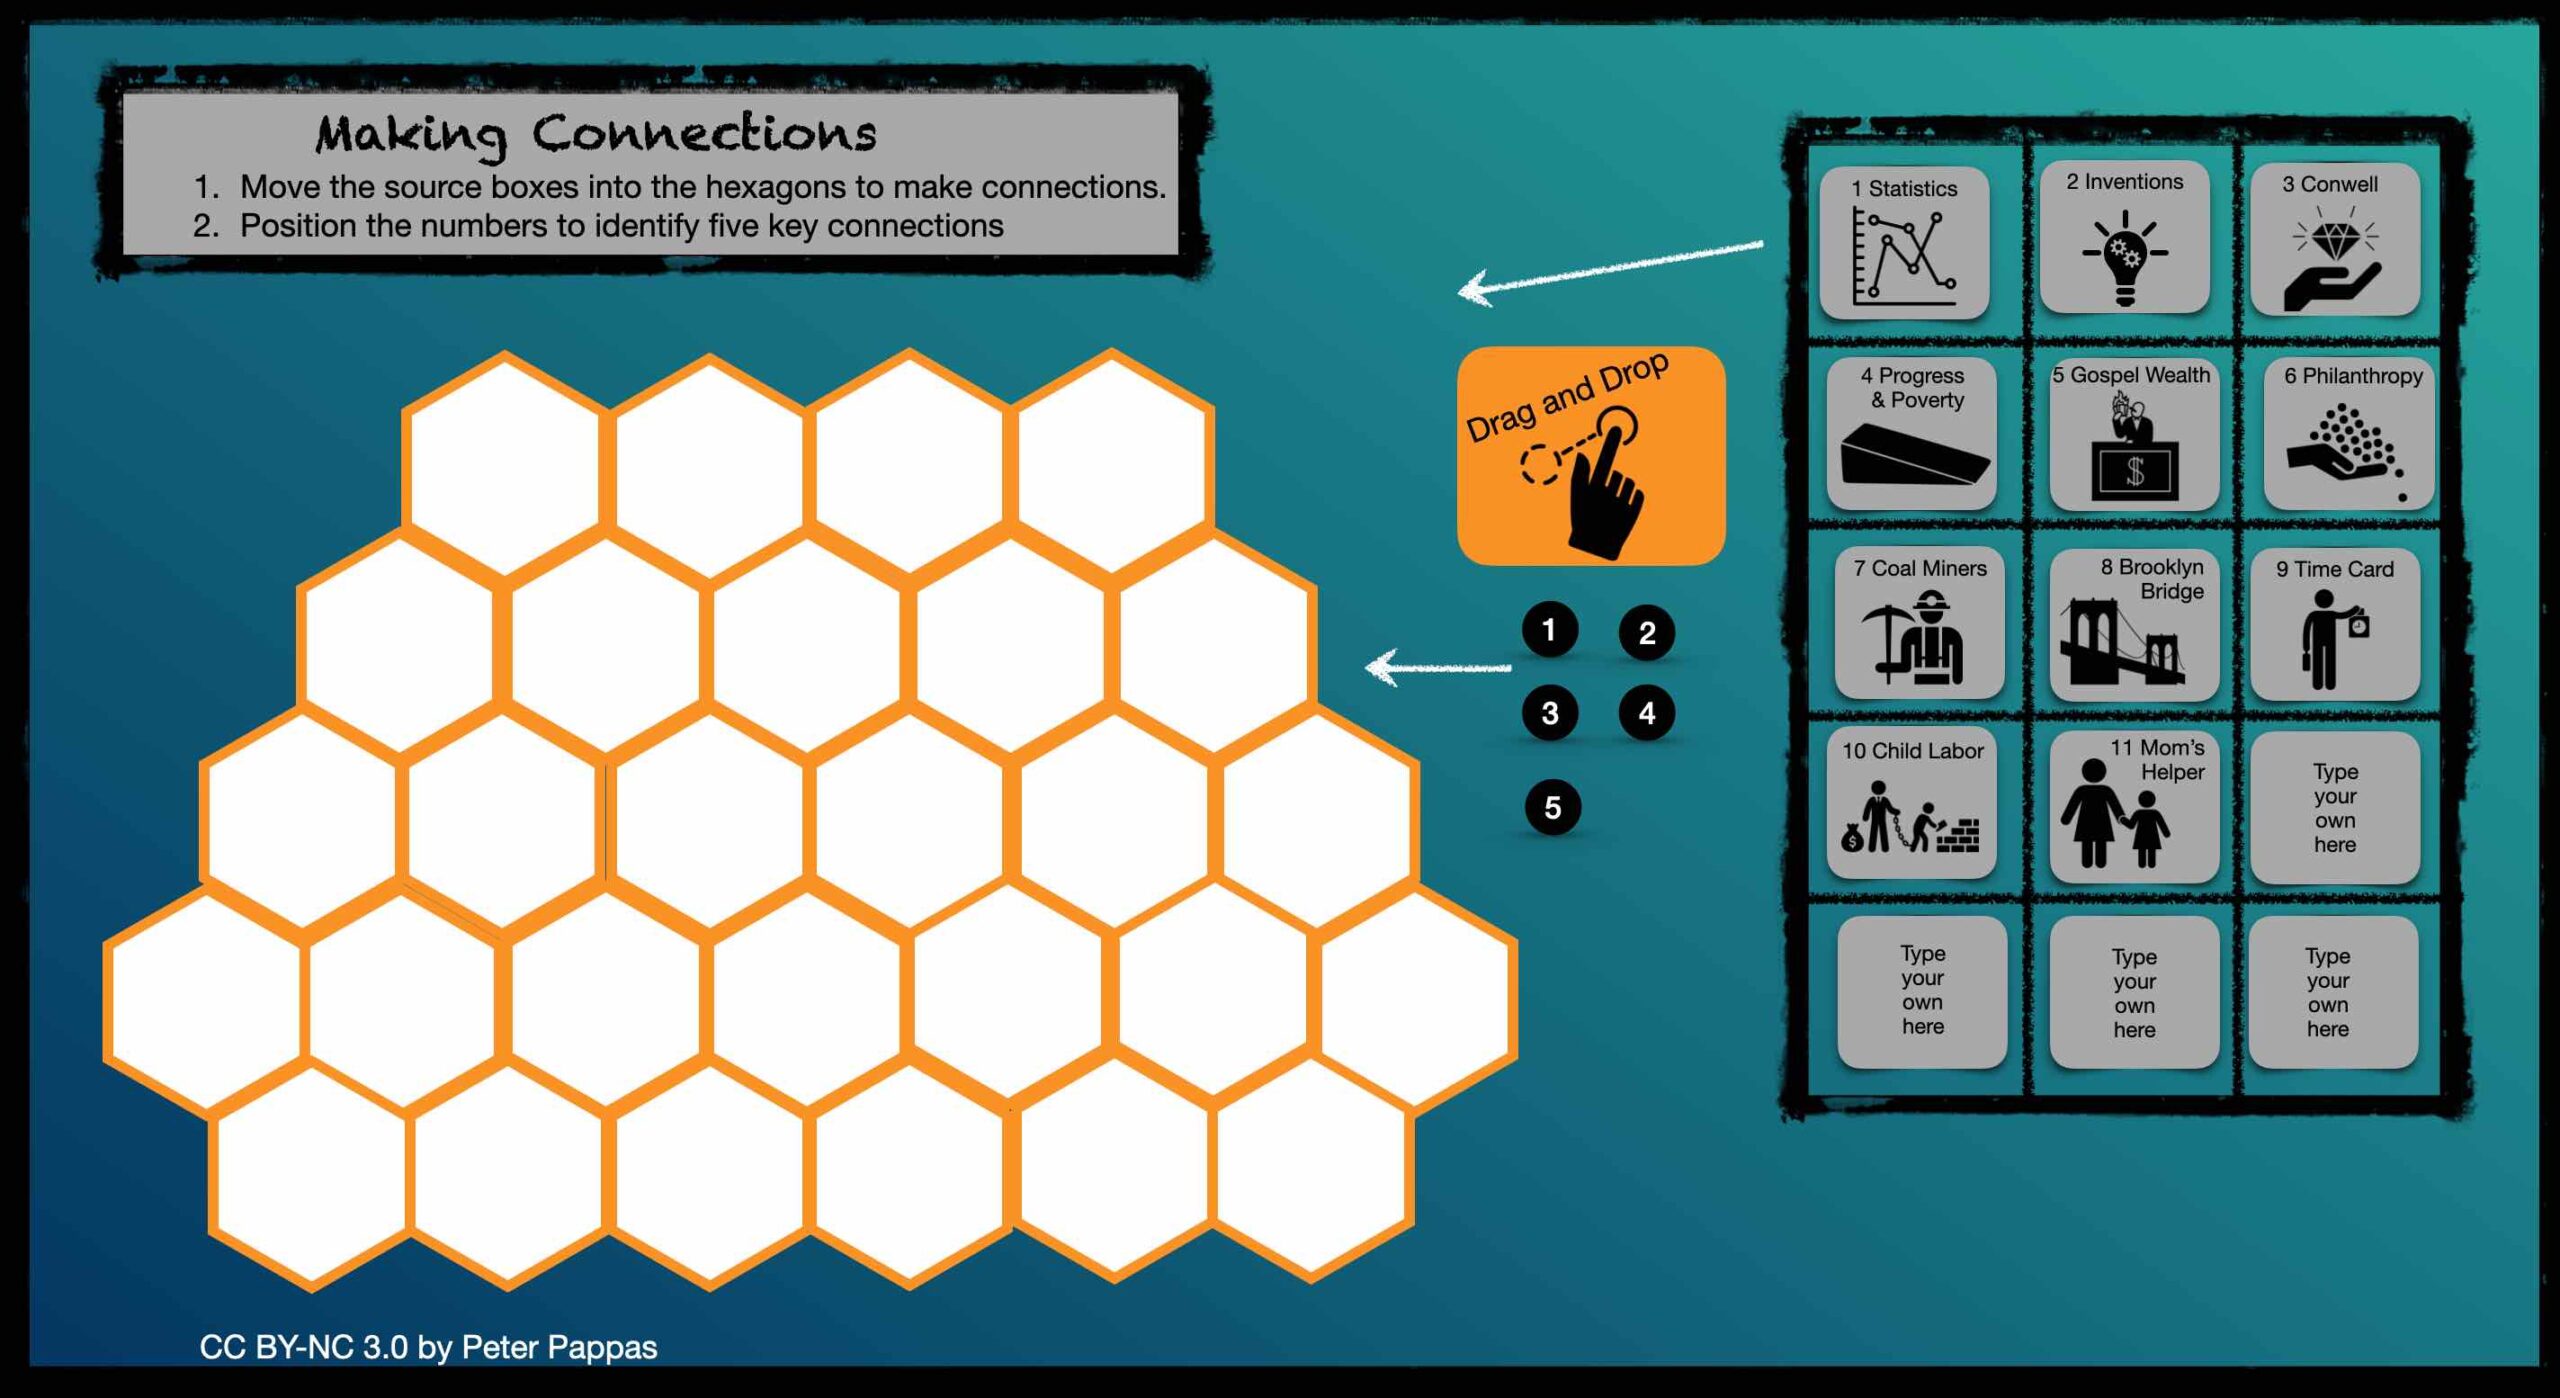
Hexagonal Thinking Corroboration Tool
They had read all the documents in advance of class. As part of our Zoom class session, I put them in breakout groups and supplied them with a Keynote file “Hexagonal Thinking Corroboration Tool.” Corroboration prompts are from SHEG. This thinking tool was inspired by this post. Keynote design adapted from here.
Instructions: Work with the members of your breakout group to corroborate the source readings.
Move the source document boxes into spaces on the grid.
Arrange the boxes so you can make connections between two or more source documents.
When you have made an association between two or more documents, move one of numbers to that point
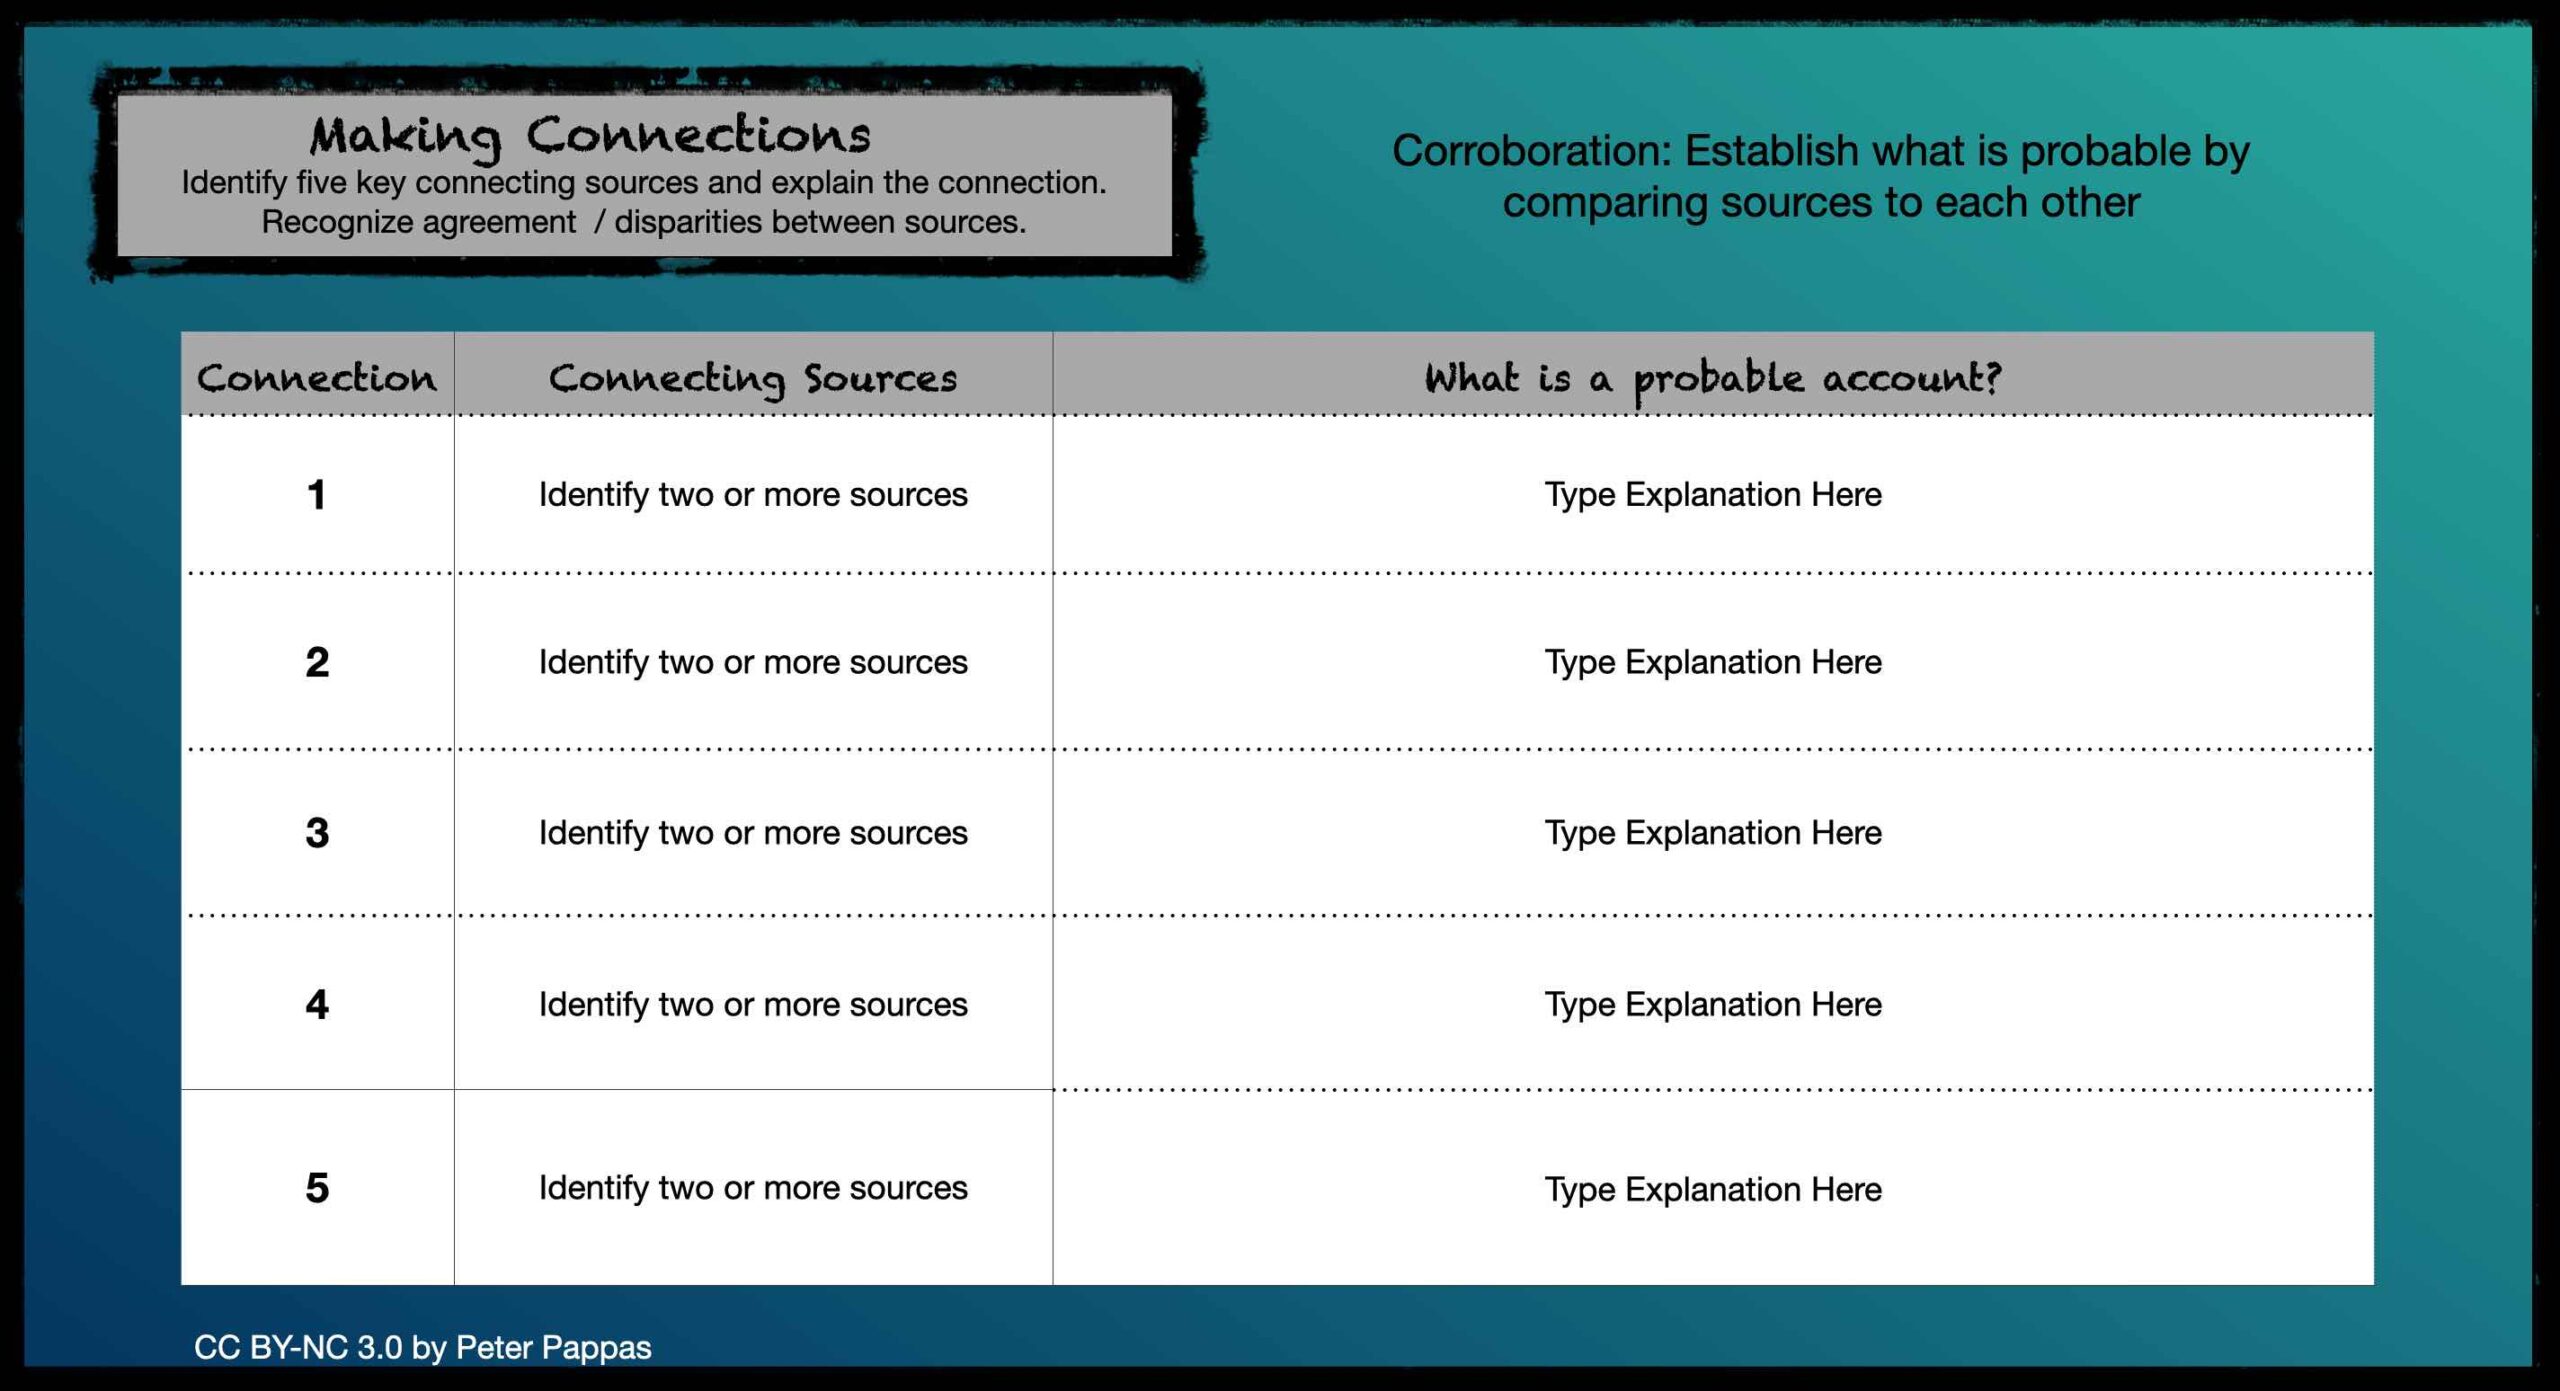
Use the final slide to identify five key connections among the documents.
Corroborate the sources in the connection and create an explanation of what you belief to be the most probable account.
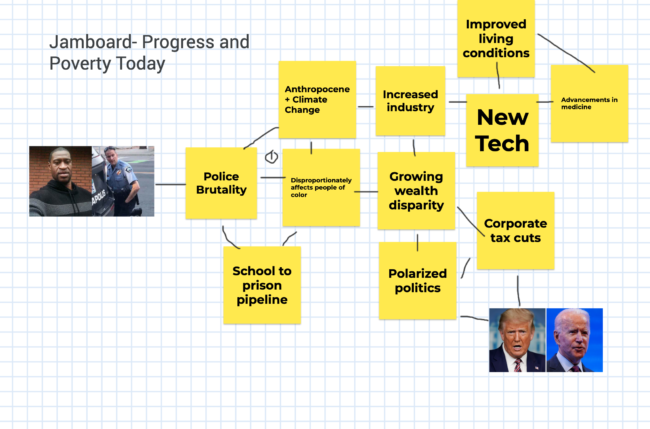
As a final exercise, I supplied them with a Google Jamboard and asked them to evaluate the question “How do we evaluate the social costs and benefits of technological innovations?” in the context of the modern world.
Teachers are looking for resources for online instruction. So I am reposting lessons from my Social Studies Methods Course at the University of Portland’s School of Education. See original post here.
Teachers can use historical documents to build literacy skills in a content area while empowering students to be the historian in the classroom. But document-based instruction in this context requires four key elements to be successful:
The right documents. (shouldn’t be reliant on background knowledge)
Knowing how to “read” the historical document.
Letting students discover their own patterns, then asking students to describe, compare and defend what they found.
Basing the task on enduring questions, the kind that students might actually want to answer.
In Class 7 we will practice some strategies for assisting students to more closely read a document (in all their multimedia formats) by answering three Common Core questions. Broad version:
What does it say?
How does it say it?
What’s it mean to me?
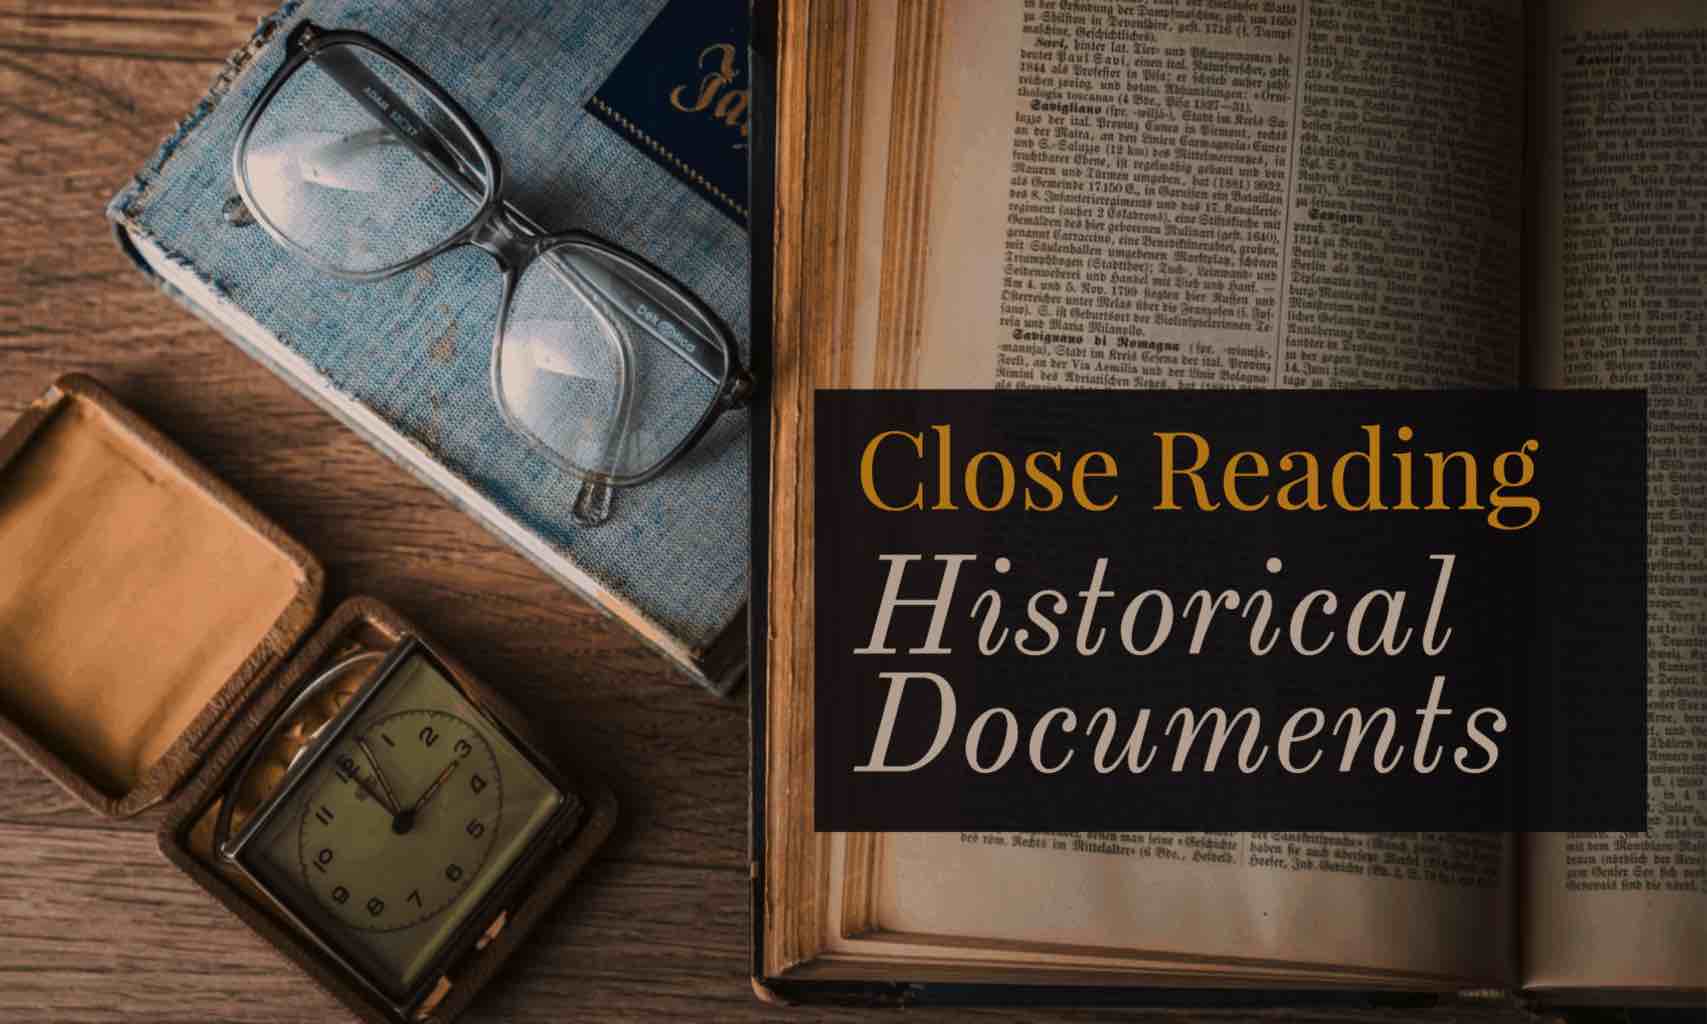
More specifically, what do we mean by close reading? Teachers can guide students with scaffolding questions that explore “texts” (in all their forms).
Key Ideas and Details:
What does the text say? Identify the key ideas. What claims does the author make? What evidence does the author use to support those claims?
Craft and Structure:
Who created the document? What’s their point of view / purpose? How did the text say it? How does it reflect its historic time period?
Integration of Knowledge and ideas:
Distinguish among fact, opinion, and reasoned judgment in a text. Recognize disparities between multiple accounts. Compare text to other media / genres. How does it connect to what we’re learning?
And what’s it mean to me?
IN CLASS ACTIVITY
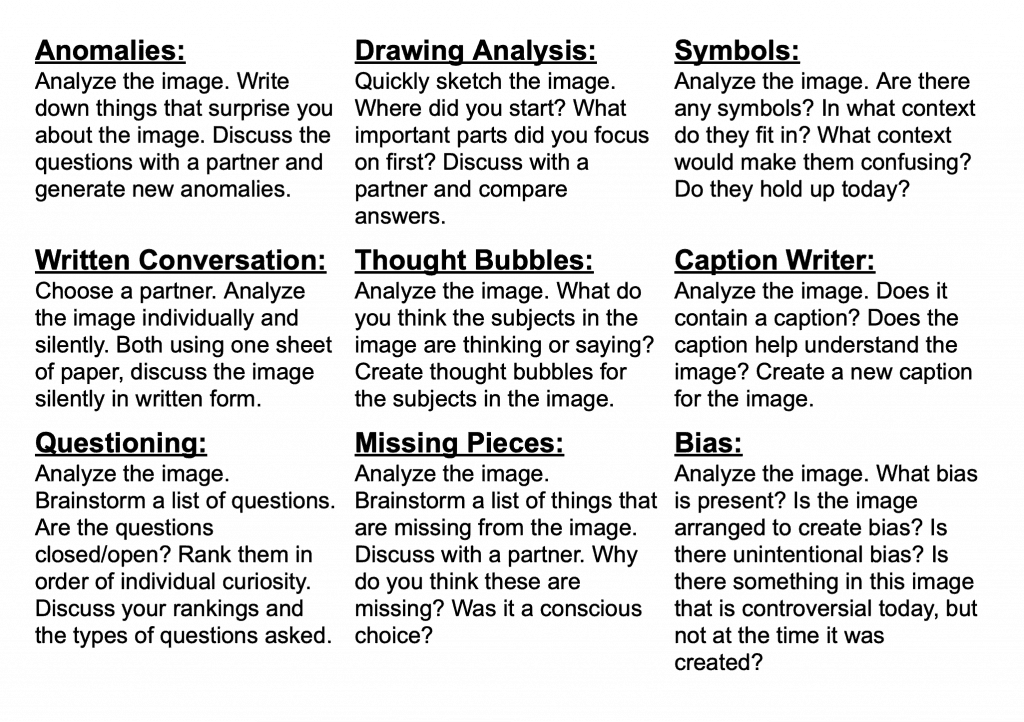
Find a historical image and pair it with one of the Primary Source Icebreakers. The post to the padlet below. Include title of icebreaker, response to prompt and hyperlinked source of image. (See example below) These icebreakers are from TPS Connect at MSU Denver.


