Test Prep – The Steroids of Student Achievement

As a life-long NYS educator, the NY Times article “Warning Signs Long Ignored on New York’s School Tests” came as no surprise. I’ve been posting on the impact of NCLB-driven standardized testing for years.

While business leaders and politicians lauded the success of the corporate-inspired standards movements, teachers knew that the impressive gains in student achievement were an illusion. As the NY TImes piece reports, for the last decade, a generation of NY students has been force-fed a steady diet of test prep designed to ready them for predictable tests.

“The fast rise… of New York’s passing rates resulted from the effect of policies, decisions and missed red flags that stretched back more that 10 years … The process involved the direct warnings from experts that went unheeded by the state and [NY] city administration that trumpeted gains in student performance… It involved the state’s decision to create short, predictable exams… making coaching easy…” NY TImes October 11, 2010

NCLB sanctions have closed failing schools that had persisted for years as “drop-out factories.” But we’ve paid a high price for accountability as measured by standardized tests. School were re-tooled to serve the needs of the test. Scarce funds were diverted to vendors who peddled programs guaranteed to improve student achievement. Creative teachers were mandated to drop the “fluff”  and teach to the test, while lecture-driven teachers droned on affirmed that it was the best way to ensure student success. Instructional time was devoted to what was tested – reading and math – so students were routinely pulled from art and music for “remediation.” A triage mentality set in among administrators who thought it wisest to focus disproportionate resources to student on the cusp of meeting standards to the detriment of other performance levels.

Of course the ones who suffered most were the students. They were forced to spend long hours engaged in an extended exercise in remembering what they were told, then practice it at their desk (or as homework) in preparation for the opportunity to give it back on the test (generally in the same form they had received it). Instead of exploring their interests, students served largely to produce performance statistics that educators could slice into measurable demographic sub groups.

While NCLB began with the admirable goal of narrowing demographic performance gaps and putting an end to sorting kids on the “bell curve,” test policy has set a course that defines student achievement in manner largely out of step with the skills our students will actually need to successful. Ironically, while our students spend endless hours prepping for predictable tests, the demand for routine skills has largely disappeared from the workplace. Anyone know of a meaningful and rewarding career that looks like filling out a worksheet?

Our kids are inheriting a world with a host of problems that will require some out-of-the-box solutions. Their success will be contingent on their ability to function independently in ever-changing situations as fluid, adaptable, and reflective thinkers. Our classrooms should be refocused on student creativity. But for now our education policy is still aimed at NCLB’s quixotic goal of all students reaching proficiency on standardized tests. Unless we institute more genuine assessments, our measures of student achievement will be as inspiring as a steroid-tarnished home run record.
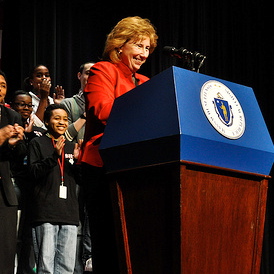
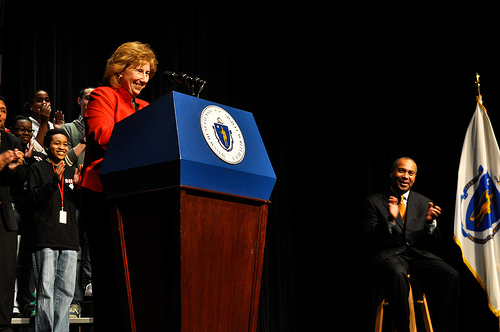
Image Flickr / Jason

Analyzing the History of the Bicycle: A Prezi DBQ

Prezi-DBQ

Click here to go the Prezi.
Then click “More” to view full screen. Use arrows at base of Prezi to navigate forward and back through a predefined path. Or use your mouse to explore and zoom the Prezi. Click on hyperlinks in the Prezi to more information about the historic bicycles.
For a PDF version of the Prezi click here.

I’m pleased to have been invited by the educators at the Smithsonian Institution to do a guest blog post using museum resources. It’s a great opportunity to illustrate a question that I often pose to educators – when do we stop modeling for students and free them to take responsibility for their learning? For example, the document-based approach (DBQ) can be a great way for students to “be the historian,” but too often we “over curate” the historic material we share with students. When that happens, the teacher is the active historian and the student is merely a passive recipient of information. For more on that subject see my post: Essential Question: Who is the Teacher in Your Classroom? All across the curriculum, students are told to “analyze” material, but their thinking is constrained by the mandated Venn diagram or T-chart. Developing a comparative schema is messy work – but that’s where the learning takes place. (Hint: letting students do the work is also central the the Common Core standards.) When the student fills out the teacher’s Venn diagram, they aren’t analyzing, they’re filing information into predefined locations. 

Of course, students do need proper scaffolding. Opportunities to learn different analytic models – cause / effect, problem / solution, sequencing, continuity / change. It makes sense to provide them some graphic organizers to help master the models. But at some point, you must turn them loose and give them the chance to explore, discover, create. Put another way, if your entire class comes back with the same comparative analysis – you did the thinking, they didn’t.

Zoe with Electra I was attracted to the Smithsonian Bicycle collection for two reasons. From an academic perspective, the images of historic bicycles could be analyzed by students without a great deal of background knowledge. My lesson provides a minimum of explanation and gives students more opportunities to develop their own model of how bicycles and bicycle culture evolved over time. On the personal side, much of the year, I live in Portland Oregon –  heartland of the urban bike culture. We don’t own a car, but rely on our bikes, walking and public transport. (That’s me with granddaughter Zoe on my Electra Townie bike). 

Some of my photographs of contemporary bikes are from Portland, where creative types continue to evolve new designs. I’ve been using Prezi on my blog and in my presentations since it was launched. For many years I’ve been an advocate of the DBQ. This is my first attempt to combine the two. 

Step 1: Choosing the Analytic Approach Students need experience using a variety of analytic approaches. Continuity and change is a perspective that has a central role in historic/chronological thinking and it can be used in other disciplines across the curriculum. In this lesson, students are given images of historic bicycles with a minimal amount of supporting text. Starting with concrete observations, students look for patterns of change and continuity (elements that changed, e.g., size / number of wheels, speed, stability and those that remained relatively constant , e.g., human powered, seated posture, need for brakes).  Finally, they are asked develop a way to express what they’ve learned. This gives them an audience other than their teacher.

7 dad-son Step 2: Making It Relevant To make learning relevant and set the stage for self-reflection, students need the opportunity to explore their own approaches. For this reason, I don’t provide a graphic organizer. That would mean that I, not the students, did the analysis. This opened-ended assignment invites students to develop their own graphic or narrative model to express what they’ve learned. Another aspect of relevance is authentic audience and purpose. Therefore I recommend that students be asked to think of how they would share their continuity/change model with younger students.

At left: Man astride “1882 Columbia Expert” with son?

Step 3: Making It Rigorous Students should begin by focusing on the lower level comprehension skills (What am I looking at? What materials were used? How were bicycles propelled and steered?) Next they can move to higher level skills.

  • Analysis – What patterns do I see in the bicycles – construction, design, features, uses? What elements do they share in common? How do they differ?
  • Evaluation – In my own judgment, what elements are changing? Which are staying the same? 
  • Creating – What have I learned about continuity and change in the history of the bicycle? How can I represent what I’ve learned to share with others? Should I use a graphic organizer? Flow chart? Time line? Diagram? Narrative?

Step 4: Encouraging Students to Reflect On Their Learning Students that have the opportunity to explore their own approaches have a learning experience that can be a basis for reflection. Since they will likely develop different analytic models than their classmates, they have a chance to compare and learn from each others’ conclusions. When asked to develop a way to explain their model to younger peers, students can reflect on how their model suits their audience and purpose. For reflective prompts you can use with your students see my Taxonomy of Reflection.

Step 5: Taking It Further These possible activity extensions can encourage students to think more about bicycles continuity, and change.

  • Consider how contemporary bicycles fit your continuity / change model, e.g., recumbent, mountain, fixed gear.
  • Design a bicycle
  • Apply the continuity / change model in another subject or discipline – fashion, architecture, musical styles, advertising, fictional characters… I could go on, but I hope you see the potential for learning.
  • Technology extension – Student could also be invited to view the world’s public photography archives at the Flickr Commons with a search by bicycle.They could help describe the photographs they discover by adding tags or leaving comments. The collection includes works from the Smithsonian and other leading international photographic archives.

Public School Teachers – Problem Or Solution?

 
Susan Szachowicz
Susan Szachowicz

A few years ago, after giving a workshop at a Chicago-area conference, I relaxed over a deep-dish pizza dinner (what else?) with a few of the other presenters. I never forgot the no-nonsense approach of  Susan Szachowicz, principal of Brockton High School. I was pleased to see her school profiled in today’s New York Times – “4,100 Students Prove ‘Small Is Better’ Rule Wrong” 9/27/2010.

While Arne Duncan, Oprah, and NBC’s “Education Nation” are busy blaming public school teachers, it was refreshing to see the NY Times highlight the turn around at Massachusetts’ Brockton High School that flies in the face of current ”educational reform du jour.” 

A decade ago, Brockton High School was a case study in failure. Teachers and administrators often voiced the unofficial school motto in hallway chitchat: students have a right to fail if they want. And many of them did — only a quarter of the students passed statewide exams. One in three dropped out.

Then Susan Szachowicz and a handful of fellow teachers decided to take action. They persuaded administrators to let them organize a schoolwide campaign that involved reading and writing lessons into every class in all subjects, including gym.

Note that this reform was led by dedicated public school teachers (including Susan, who later became principal) advocating a return to basics – reading, writing, speaking, reasoning. It wasn’t a top-down mandate, restructuring or charter school take over. It was a (unionized) teacher-led initiative, supported by thoughtful administrators. It took place at one of the largest high school in the country – so much for Bill and Melinda’s “small is beautiful” approach. 

Are public school teachers the problem or are they part of the solution? It depends on whether their unions put job security ahead of student performance. Teachers are responsible for results. But educational leaders, parents and the community are also responsible to support them. Accountability is reciprocal.

Kudos to the entire Brockton High School community. Their collaborative focus on instruction has resulted in dramatic improvements in student performance. It’s a lesson for parents, school leadership teams, teacher unions and education policy makers. Maybe Brockton can star in a sequel to “Waiting for Superman.” 

Image credit: Flickr/Office of Governor Patrick

Curriculum for Excellence – Educational Policy That Values Students and Trusts Teachers

Curriculum for Excellence

American education has been hijacked by policy makers who don’t trust teachers, unions that are over-protective of job security, a private sector eager to privatize, and a standardized testing regime that rewards test prep over genuine learning. In the middle of it all, bored students disconnect from school as they realize that their main function is to be trivialized into a source of data for adults looking for someone to blame.

While America educational leadership offers hollow sound bites about life-long learning, Scotland’s Curriculum for Excellenceoffers us insight into what American kids are missing. This video produced by the Scottish program offer a quick introduction to three project-based approaches. Here’s two quotes from the video that say it all:

~ A student,  ”When you’re just copying a text book … you’re looking at results which people have already achieved and proved their work…  but when you doing it yourself you get an idea of how things work … and what you actually need to make things successful.”

~ A teacher,  ”In this approach … your not teaching the subject in isolation – your teaching in a much more natural way … with greater depth and more enrichment… there’s an accessible point for every child in the class and they can build on that and take it in directions of their own personal interests.” 

Turn Your Students into Data-Driven Decision Makers

How is your educational technology being used? Teacher in front of the class lecturing on the smartboard? Or are students using ed tech to analyze, evaluate and create in ways that were not previouslypossible. I’ve written about one example, Wordle, a free Web 2.0 tool that enables students to interpret, qualify and visualizes text in new ways.

Another powerful data visualizer is the Motion Chart. It’s a dynamic flash-based chart that explores multiple indicators and visualizes growth over time. Gapminder World has assembled 600 data indicators in international economy, environment, health, technology and much more. They provide tools that students can use to study real-world issues and discover trends, correlations and solutions. Here’s Gapminders’s Hans Rosling showing how teachers and students can use the free Gapminder Desktop to develop there own motion charts using Gapminder data. 

To download a free version of Gapminder Desktop and access more educational resources go to Gapminder for Teachers. If you would like to build motion charts using your own data visit Google Gadget Motion Chart. (It’s the engine behind Gapminder.)  Motion Chart is a free gadget in Google Spreadsheet. In Motion Chart you can convert your data-series into a Gapminder-like graph and put it on your web-page or blog. All you need is a free Google-account. More info on Motion Chart 

New educational technology does not automatically improve the quality of instruction. We have all sat through dull PowerPoint presentations that were as “mind-numbing” as an overhead. Our return on technology investments may not be tracked in test scores that simply measure lower-order recall of information. A better metric would gauge if an educational technology gave students the tools to analyze, evaluate and create as professionals do. All skills demanded by the new Common Core standards.