Between 1936 and 1966, the “Negro Travelers’ Green Book” (or the “Green Book” as it was commonly known) was an essential travel guide for Black Americans. It was created by Victor H. Green, an enterprising New York mailman and Black-American travel agent. Organized by state and city, it listed business who would accept black clientele – hotels, restaurants, filling stations, tailors, beauty parlors. It also included travel themed articles featured black-friendly resorts and sites. For more see my post Segregated America’s TripAdvisor.
Enter the world of the Black traveler in post-war America who faced humiliation, insults and fear of being stranded without travel essentials.
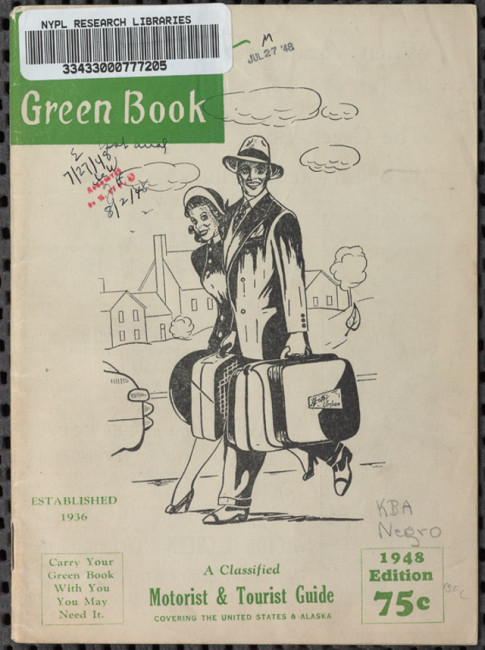
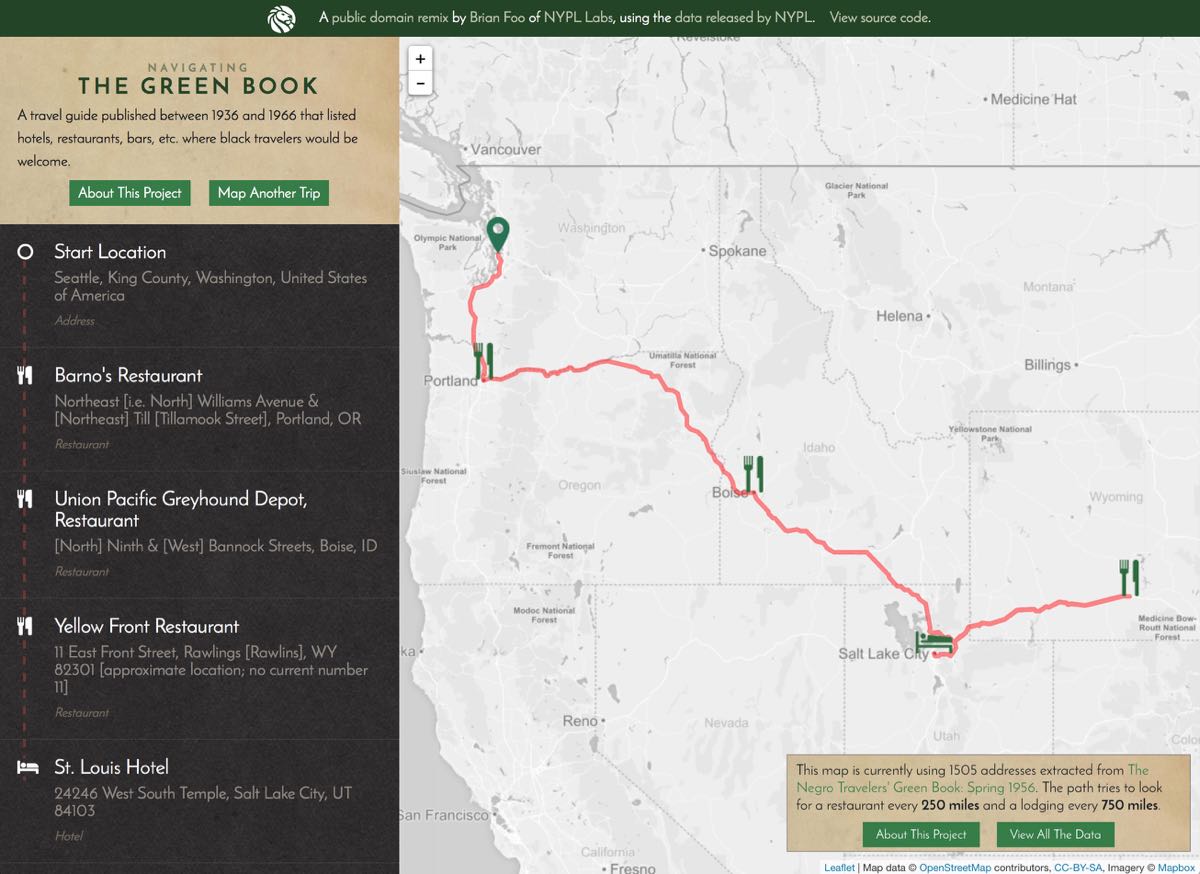
The New York Public Library’s Digital Collections recently launched Navigating The Green Book, a public domain remix by Brian Foo of NYPL Labs. The mapping tool give the user insights into the world of the Black traveler in post-war America who faced humiliation, insults and fear of being stranded without travel essentials. Racist social codes made “driving while black” a hazard in some locales. As the Green Book noted its the cover, “Carry Your Green Book With You – You May Need It.”
Users can enter in two US addresses and determine what Green Book recommended services they’d find along the route (two data sets are currently indexed – 1947 and 1956.) Here’s a 1956 trip from Seattle to Salt Lake City. Only three restaurants and one hotel.
Users can also use a cluster or heat maps to visualize the the geotagged data. Here’s a “heat map” of US in 1956. Yellow / red colors indicate more Black-friendly services.
Finally at the listing level, the user can click into any of locations and get specific metadata including a link to a digitized version of the Green Book page for the service. (1956 Green Book)
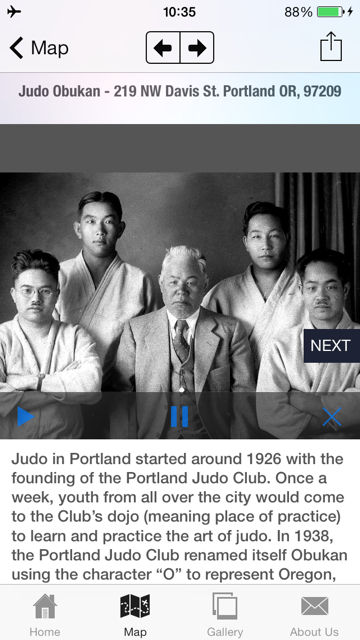
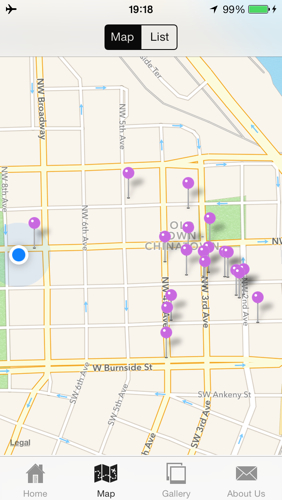
I’m pleased to introduce you to Japantown PDX, a free iPhone app that I designed with the assistance of the Oregon Nikkei Legacy Center, GammaPoint LLC, and my students at the University of Portland. Explore Portland Oregon’s historic Japantown with this user-friendly walking tour. The city’s vibrant pre WWII Japanese American community is archived in over 125 photographs and audio clips. This GPS-enabled app guides you through Portland’s eight block Japantown, a bustling community in the early decades of the twentieth century – better known today as the colorful Old Town / Chinatown neighborhood. Map
ThefreeiOSapp documents the vitality of this once thriving “Nihonmachi” and its sudden disappearance in the spring of 1942 when all persons of Japanese ancestry were removed from the West Coast and placed in America’s concentration camps during WWII. In addition to telling Portland’s Japantown story, the app explores the remarkably diverse Old Town neighborhood in tour stops that honor its African American, Chinese and LGBT roots.
Todd Mayberry, the Director of Collections and Exhibits at Nikkei Legacy Center speaks to the role this app can play in promoting the historic importance of Portland’s Nihonmachi and the need to preserve it from the ever-present threat of historically inappropriate over development.
“This innovative app will guide users beyond the walls of our museum and into the heart of Portland’s historic Japanese American community. Explore our streets and buildings guided by our narrator and mapped collections of photographs. We can’t wait to welcome you back to our home.”
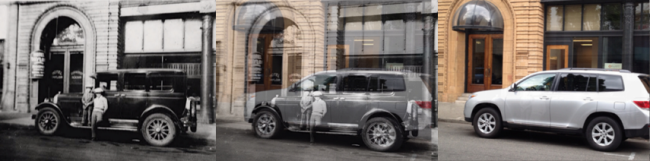
App Features Our goal was to design a user-friendly app suitable for all technical “abilities.” We began by surveying the Nikkei Center’s rich collection of historic photos for location-specific images. The most notable and well-documented became our tour stops. When we had historic exterior shots we photographed the contemporary scene replicating the view. Thus users can watch historic Japantown street life reappear in “then and now” dynamic photographic dissolves. Each stop has multiple historic and contemporary images, text and an audio narration. We had many historic photos that told the story of a vibrant community, but they lacked location. We decided to include them in the app as a “Gallery Section.” The app also allows users to share image content with built in Facebook and Twitter buttons.
We also wanted to weave in an underlying narrative – the story of WWII’s Executive Order 9066, the forced incarceration of the neighborhood’s Japanese Americans first at the “temporary” Portland Assembly Center and eventually at the Minidoka concentration camp located in southern Idaho. While the app is location based, we elected to give it an narrative arc that begins with an opening audio greeting voiced by Jean Matsumoto who grew up in the pre-WWII Japantown. Jean and her family were among over 110,000 Japanese Americans that were removed from the West Coast and incarcerated without trial. The app details other stories of forced relocation and re-population of the the neighborhood after the war and invites users to learn more by exploring the exhibits at the Nikkei Legacy Center in the heart of historic Japantown. Map
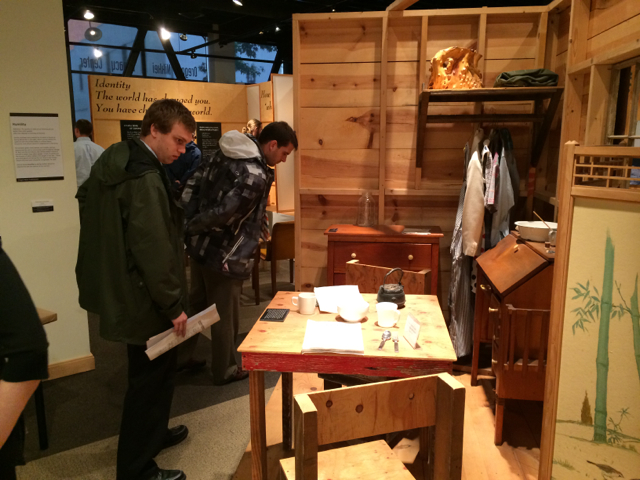
UP Students Explore Nikkei Center Concentration Camp Exhibit
About the Project Team
This app grew out of a collaboration between my Social Studies Methods class at the University of Portland and the Nikkei Legacy Center. It was one of three curriculum design projects undertaken by students in support of the museum’s educational outreach. For more see my post Student Consultants Design Museum Curriculum and Mobile App.
My class served two roles in the app development – the entire class became our focus group – discussing what they thought needed to be in the app – both from the perspective of user experience and their growing knowledge of the history of Portland’s Japantown. Three student’s worked more directly – narration (Aram Glick), audio recording (Collin Soderberg-Chase) and logo (Samuel TS Kelly). I worked closely with Todd Mayberry to select content and images.
The other key team member was GammaPoint LLC a Portland-based mobile app developer and designers of my favorite workout app - WeatherRun. GammaPoint was interested in designing a user-friendly platform that would allow organizations to develop their own tour apps with a minimum amount of assistance. Our project served as their beta. We worked with GammaPoint on developing the tour design, generating prototypes which were then evaluated by my students and Nikkei Center. For example, we discovered that while we had a wealth of video interviews of former Japantown residents, their file size bloated the app. We used plist files to upload data to GammaPoint and tested their new web-based upload tool. It has now evolved into GammaPoint’s App4Tour which promises to be an affordable way for users to create their own multi-media rich tours with minimum of technical assistance.
Games are interaction with rules. They mimic the scientific method – hypothesis tested to overcome obstacles and achieve goal while operating inside prescribed system of boundaries. Video games provide failure based learning – brief, surmountable, exciting. While failure in school is depressing,
in a video game, it’s aspirational.
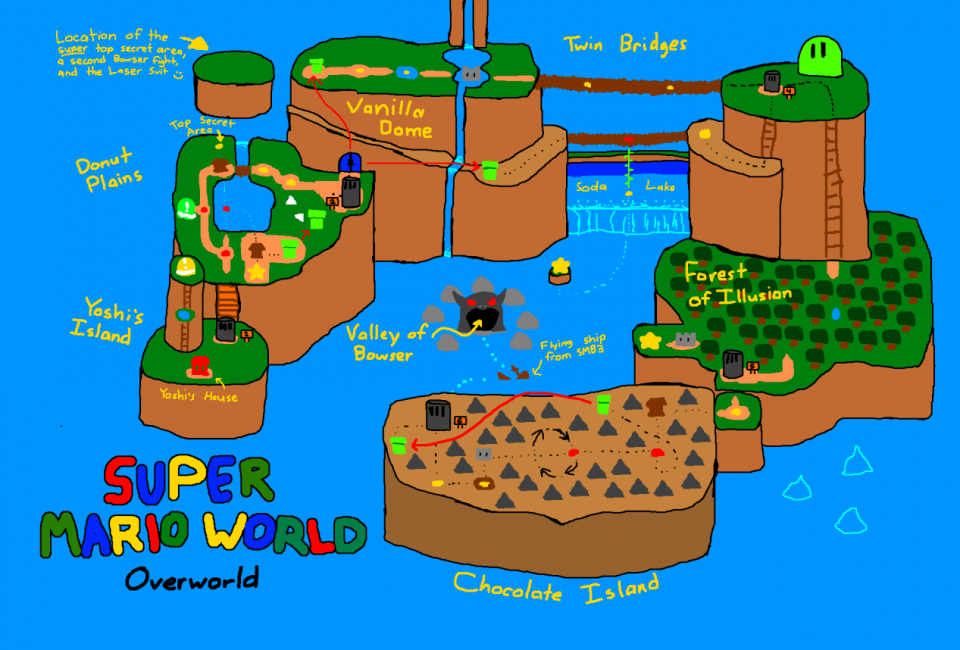
Super Mario World world map by fliptaco
Josh Millard recently began curating a growing collection of video game maps drawn from memory at his site Mapstalgia. He writes,
We spend time in video game worlds, learning our way around the constructed environments. We make mental maps of these places as part of the process of trying to progress through them. We learn where the good bits are hidden, remember the hard bits that got us killed every damn time. The worlds may be fictional but our mental maps of them are as real as anything else we remember. And they’re shared experiences: my experience in Super Mario Bros. was a lot like yours, and even if we never played it together, it’s a space we have in common. And the way our memories overlap, and the ways they differ — the commonalities and contrasts of our individual recalls of these shared spaces — is a really interesting and as far as I’ve seen mostly undocumented emergent result of decades of videogaming experiences. So let’s draw these remembered maps. Let’s put it down on graph paper or napkins or MS Paint.
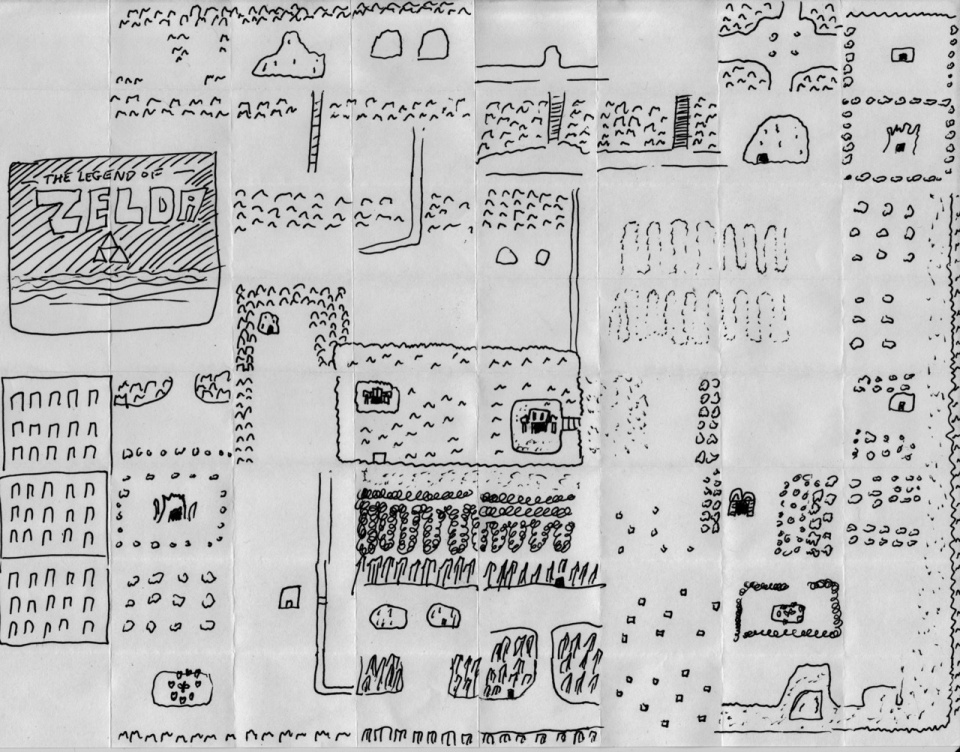
The Legend of Zelda world map by themadjuggler
Submissions range from detailed renderings to simple sketches. They all demonstrate a great way to teach mental mapping skills – spatial relationships, sequence, causation, scale, location, and measurement. Use Mapstalgia to inspire your students. Then give them a chance to have fun while demonstrating their ability to translate gaming worlds into two dimensional representations. Let them compare maps of the same game to design their own mapping rubric. Explore different representations of game elements for clarity and design.
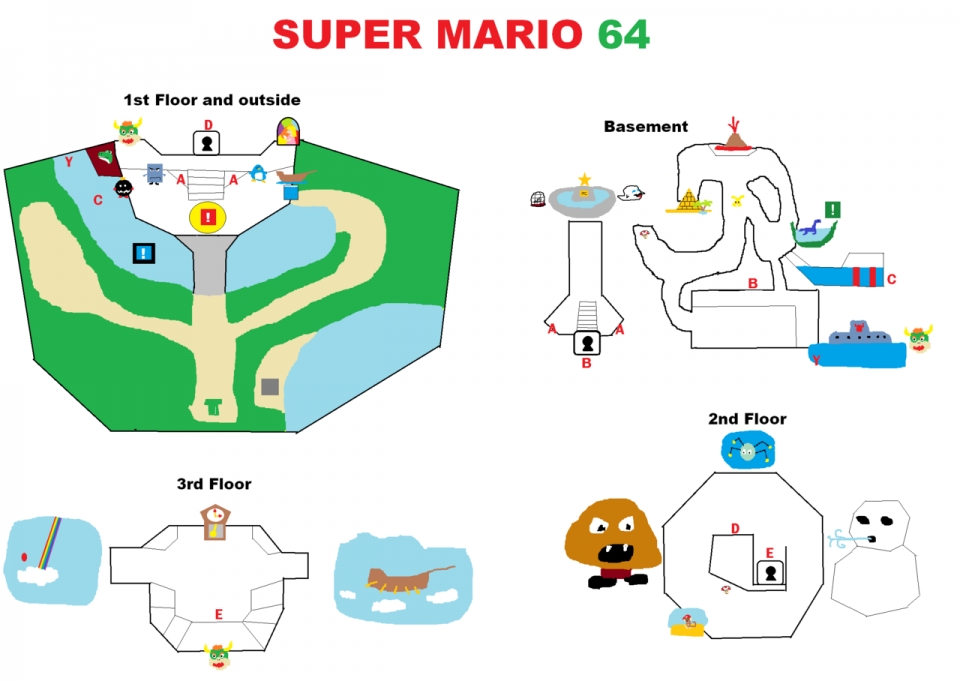
Super Mario 64 Peachs Castle by GNM
Get students hooked working with something they know intimately – video games. Then transfer those visual literacy skills to more traditional mapping instruction as well as exploration of symbolic representations of all kinds.
I recently featured a guest post from High Tech High’s David Stahnke and Margaret Noble that detailed their award-winning student multimedia exhibit “Illuminated Mathematics.”
Margaret is back with another student project, partner and guest post. Text by Rachel Nichols and Margaret Noble.
Complex City: Animated Maps of San Diego Project and student exhibition developed and coordinated by High Tech High teachers – Rachel Nichols (English) and Margaret Noble (Multimedia).
Link to the Complex City exhibit sitewith additional student work.
Our Essential (Guiding) Questions
San Diego’s military bases drastically outnumber the facilities meant to help veterans with post war trauma. ~ Tobi Brik
How do we help students to become more aware of their surroundings, in order to foster an educated, ethical, and empathetic community?
How do we facilitate opportunities that help students translate experiences, investigations, and ideas into artistic renderings that effectively communicate new knowledge?
Summary We devised an experiential project, “Complex City” in order to help students think critically about their communities. In asking them to map an area of San Diego that had significance to them, we wanted them to step back from the familiar aspects of their community and city, and translate those aspects into a visual map. As part of this project, students researched, interviewed, and investigated their city and community in myriad ways. What they once thought was familiar suddenly became very unknown. By compiling their work and making collective and idiosyncratic maps of San Diego, they have been challenged to rethink what they understood to be the reality of the built environment around them, as well as to accept the new knowledges that their classmates contribute. They have become more invested in their own community because their new knowledge implicates them as involved citizens. These maps collect particular versions of this place (versions not always visible to others, or in traditional maps) as we see it in the fall/winter of 2011.
Student Assignment
From pursuing this question my love for marine life grew and my desire to help raise awareness for San Diego’s waters grew … I have a responsibility to get reckless boaters to be more cautious. ~ Jasmine Thomas
In this project, you will be making an animated map of San Diego based on your wanderings, interviews, research, and experiences. In short, you will be creating a map of San Diego that collects particular versions of this place (versions not always visible to others, or in traditional maps). Using Rebecca Solnit’s Infinite City as one model, and our own creative explorations as another, we will be collecting data in the form of sounds, photos, historical information, interviews, and ephemera, and we will be compiling this data to make a series of complementary, contradictory, confounding or even contestatory maps of San Diego. We will be looking at Infinite City in detail, as well as working with archivists, historians, and community members to think creatively about mapping.
Bench Marks Research Paper Outline, Story Board of Map – Oral Presentations
Rough Research Draft Paper, Map Draft 2, Final Research Paper
Map Animation Draft 1 with Critiques, Map Animation Revised with Critiques, Final Animation
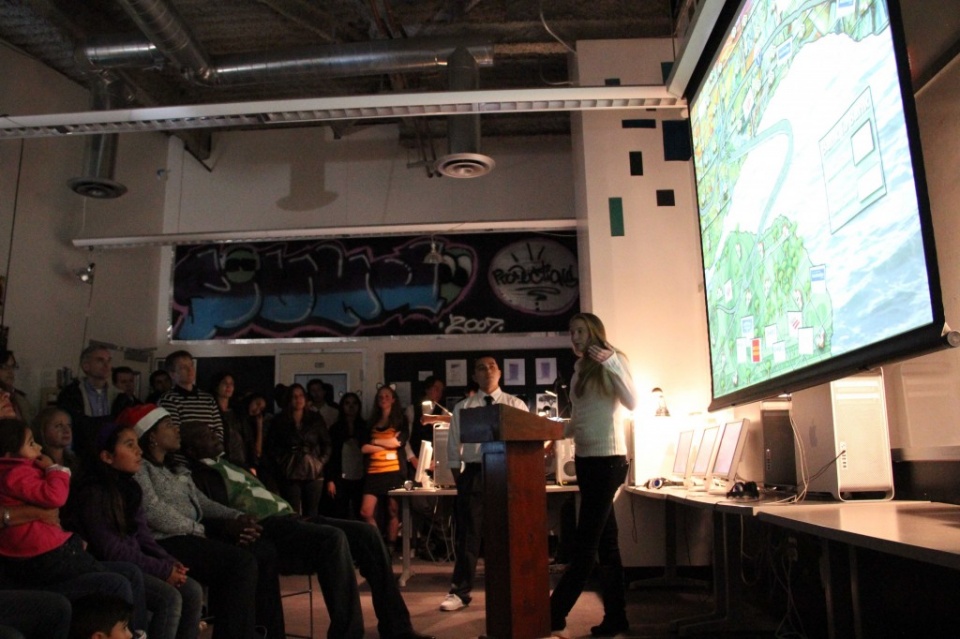
Public Exhibition – Projection Art and Research Presentations
Complex City Public Exhibition
Three Essential Components:
1. Research Audio: 2-3 interviews relating to the theme/topic of your map. Each of these interviews will take the final form of a 2-3 minute piece, edited down from a 45-minute interview. Also record ambient noise and sonic data from your theme/topic. See example at The Soundlines Project.
2. Textual: a. One 6-8 page final paper per group (double-spaced; between 1500-2000 words). This draft should be divided into sections that include historical information, relevant current facts and anecdotes, and a critical analysis of the map and its meaning. The draft should be clearly marked as to which member of the group authored which sections. We will critique and workshop these papers.
b. Type a transcript from each of your interviews to turn in with final paper (due November 18th)
3. Visual: design, cartography and photography relevant to your project inquiry.
Project resources courtesy of Rachel Nichols and Margaret Noble
Gem City Atlas Rebecca Solnit’s work with students at the University of Wyoming
Gap Minder– A non-profit venture- a modern “museum” on the Internet – promoting sustainable global development and achievement of the United Nations Millennium Development Goals.
Excellent interactive map that details the 2010 census. Plug in your zip code and see what you find.
GeoCommons is the public community of GeoIQ users who are building an open repository of data and maps for the world. The GeoIQ platform includes a large number of features that empower you to easily access, visualize and analyze your data.
Strange Maps showcases very cool maps and map ideas.
Mike Wirth Art Samples from a very creative designer who makes fantastic infographics.
Grassroots Mapping – founded by a group of activists, educators, technologists, and community organizers interested in new ways to promote action, intervention, and awareness through a participatory research model.
Effective infographics enable us to see information in new ways. The Economist recently posted these two interactive maps that offer insights into the distribution of GDP and population in both the US and China. Click on maps or follow links to original maps with full functionality.
Which countries match the GDP and population of America's states? Original Map
Which countries match the GDP, population and exports of Chinese provinces? Original Map