Worksheets and Kodachrome: Lessons in Kodak’s Bankruptcy

This week Eastman Kodak filed for bankruptcy. Is there a lesson for educators about what happens when you lose touch with your customer?

First some personal background. I’m from Rochester New York – “The Kodak City.”
My dad worked at Building 29 – right at the heart of the business. Rotating through round-the-clock shifts, literally working in the dark, he mixed the chemicals that became film. One of Kodak’s many benefits, was a guaranteed job for your children when they reached college age. So in the late ’60’s, during my college summers, I worked at Kodak. The first two summers I worked on the Kodak railroad. Yes, Kodak ran it’s own track and trains within the 1,200 acre Kodak Park industrial complex. The summer before my senior year, I washed tour buses and drove the Kodak ambulance. If I remember correctly, I was making more than triple the minimum wage.

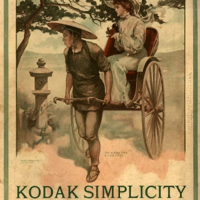
Of course, Kodak could afford to be generous to its workers (and extremely philanthropic to the Rochester community). It had a monopoly on the film market. George Eastman had transformed the complexities of the 19th century photographic “chemistry set” into something easy that anyone could do. He understood that his customers wanted simplicity. In the early days of the 20th century he pitched his cameras with the slogan “You push the button, and we do the rest.” (Users of the early Brownie cameras shipped their cameras to Rochester, where the film was taken out, processed and printed. Their reloaded camera and finished prints were shipped back to them.) Kodak continued to simplify with innovations, like drop-in film cartridges, but they always maintained control of all phases of the photographic process – dominating the markets for film, film processing, processing chemicals, and photographic paper.

At the same time the George Eastman popularized photography, compulsory public education brought education to the masses. Instruction was based on the notion that you could tell people what they needed to know. State education departments, publishers and teachers decided what was important and then delivered it to students via textbook and lectures. Perhaps the unstated slogan of that instructional model was “you listen and take the notes, and we do the rest.”

Ironically Kodak sowed the seeds of its own demise by pioneering digital photography in the mid 70’s. But the innovators at Kodak’s Apparatus Division Research Lab couldn’t make the case for “Film-less Photography” as it was called. “Why would anyone ever want to view his or her pictures on a TV? How would you store these images? What does an electronic photo album look like?” More on the first digital camera

Kodak leadership couldn’t accept challenges to their traditional photosensitive film model, so they licensed their digital patents to other companies who began creating the first digital cameras. Kodak’s leaders scoffed at the primitive digital images, and continued to milk their cash cow. The only thing to fear was losing market share to film competitors like Fuji Film.

At the core of Kodak’s eventual demise was the failure of the leadership to remain connected to their customers. They convinced themselves that the public would continue to want to buy film, load it into the camera, take a picture, drop the film off at the processor, and return later to pick up their photos. Easy to believe when you’re making money at every stage of that process. Leadership wouldn’t accept that their customers wanted greater control and functionality over the imaging process. Users would be willing to forgo the quality of the Kodachrome for the ability to do new things with images. Manipulate them, mash images up with other content, e-mail them off to someone, and perhaps never actually print a photo.

So do education leaders have something to learn from the bankruptcy of Kodak? Is their obsession with standardized achievement test data as misguided as Kodak tracking Fuji’s market share? Will innovative teachers get tired of explaining “the effectiveness of social media in the classroom” to their school board and leave the profession?

Has our educational leadership lost touch with their customers – the students? Given the growing array of cheap digital tools available to our students, will they passively wait to be told what, how, when and with whom to learn? Is the information flow of the traditional classroom (lecture, note-taking, test) as outmoded as taking your film to the drugstore for processing?

Given all the technologies available for students to direct their own learning, how much longer can the traditional school survive? When will worksheets go the way of Kodachrome?

Image credits: Emergence of Advertising in America On-Line Project

Kodak Simplicity
Kodak advertisement, 1905
Ad#K0431

Let the Children Kodak
Kodak advertisement, 1909
Ad #K0082

John W. Hartman Center for Sales
Advertising & Marketing History
David M. Rubenstein Rare Book & Manuscript Library
Duke University

Mental Mapping: Video Game Maps Drawn From Memory

Games are interaction with rules. They mimic the scientific method – hypothesis tested to overcome obstacles and achieve goal while operating inside prescribed system of boundaries. Video games provide failure based learning – brief, surmountable, exciting. While failure in school is depressing,
in a video game, it’s aspirational.

Super Mario World world map by fliptaco

Josh Millard recently began curating a growing collection of video game maps drawn from memory at his site Mapstalgia. He writes,

We spend time in video game worlds, learning our way around the constructed environments.  We make mental maps of these places as part of the process of trying to progress through them.  We learn where the good bits are hidden, remember the hard bits that got us killed every damn time.  The worlds may be fictional but our mental maps of them are as real as anything else we remember.  And they’re shared experiences: my experience in Super Mario Bros. was a lot like yours, and even if we never played it together, it’s a space we have in common.  And the way our memories overlap, and the ways they differ — the commonalities and contrasts of our individual recalls of these shared spaces — is a really interesting and as far as I’ve seen mostly undocumented emergent result of decades of videogaming experiences. So let’s draw these remembered maps.  Let’s put it down on graph paper or napkins or MS Paint. 

The Legend of Zelda world map by themadjuggler

Submissions range from detailed renderings to simple sketches. They all demonstrate a great way to teach mental mapping skills – spatial relationships, sequence, causation, scale, location, and measurement. Use Mapstalgia to inspire your students. Then give them a chance to have fun while demonstrating their ability to translate gaming worlds into two dimensional representations. Let them compare maps of the same game to design their own mapping rubric. Explore different representations of game elements for clarity and design.

 
Super Mario 64 Peachs Castle by GNM

Get students hooked working with something they know intimately – video games. Then transfer those visual literacy skills to more traditional mapping instruction as well as exploration of symbolic representations of all kinds.

Sonic Adventure 2 City Escape by cubeybooby
Zork excerpts by ErWenn

Image credits: Mapstalgia

Finding Math in Nature’s Patterns

Succulent spiral
Succulent spiral

As I recently wrote in Don’t Teach Them Facts – Let Student Discover Patterns 

It’s unfortunate that student don’t get to use their innate perceptual skills more often in the classroom. Instead of discovering patterns on their own, students are “taught” to memorize patterns developed by someone else. Rather than do the messy work of having to figure out what’s going on, students are saddled with graphic organizers which take all the thinking out of the exercise. 

“Doodling in Math Class: Spirals, Fibonacci, and Being a Plant” captures the fascination of patterns in nature. Discover more patterns from Vi Hart – Mathemusician

Image credit: flickr/Duff Axsom

Complex City: Student Designed Animated Maps

ComplexCity
Complex City

I recently featured a guest post from High Tech High’s David Stahnke and Margaret Noble that detailed their award-winning student multimedia exhibit “Illuminated Mathematics.”

Margaret is back with another student project, partner and guest post.
Text by Rachel Nichols and Margaret Noble.

Complex City: Animated Maps of San Diego
Project and student exhibition developed and coordinated by High Tech High teachers – Rachel Nichols (English) and Margaret Noble (Multimedia).
Link to the Complex City exhibit site with additional student work.

Our Essential (Guiding) Questions

San Diego’s military bases drastically outnumber the facilities meant to help veterans with post war trauma. ~ Tobi Brik

  • How do we help students to become more aware of their surroundings, in order to foster an educated, ethical, and empathetic community?
  • How do we facilitate opportunities that help students translate experiences, investigations, and ideas into artistic renderings that effectively communicate new knowledge?

Summary
We devised an experiential project, “Complex City” in order to help students think critically about their communities. In asking them to map an area of San Diego that had significance to them, we wanted them to step back from the familiar aspects of their community and city, and translate those aspects into a visual map. As part of this project, students researched, interviewed, and investigated their city and community in myriad ways. What they once thought was familiar suddenly became very unknown. By compiling their work and making collective and idiosyncratic maps of San Diego, they have been challenged to rethink what they understood to be the reality of the built environment around them, as well as to accept the new knowledges that their classmates contribute. They have become more invested in their own community because their new knowledge implicates them as involved citizens. These maps collect particular versions of this place (versions not always visible to others, or in traditional maps) as we see it in the fall/winter of 2011.

Student Assignment

From pursuing this question my love for marine life grew and my desire to help raise awareness for San Diego’s waters grew … I have a responsibility to get reckless boaters to be more cautious. ~ Jasmine Thomas

In this project, you will be making an animated map of San Diego based on your wanderings, interviews, research, and experiences. In short, you will be creating a map of San Diego that collects particular versions of this place (versions not always visible to others, or in traditional maps). Using Rebecca Solnit’s Infinite City as one model, and our own creative explorations as another, we will be collecting data in the form of sounds, photos, historical information, interviews, and ephemera, and we will be compiling this data to make a series of complementary, contradictory, confounding or even contestatory maps of San Diego. We will be looking at Infinite City in detail, as well as working with archivists, historians, and community members to think creatively about mapping.

Bench Marks
Research Paper Outline, Story Board of Map – Oral Presentations
Rough Research Draft Paper, Map Draft 2, Final Research Paper
Map Animation Draft 1 with Critiques, Map Animation Revised with Critiques, Final Animation
Public Exhibition – Projection Art and Research Presentations

 
Complex City Public Exhibition

Three Essential Components:

1. Research Audio: 2-3 interviews relating to the theme/topic of your map. Each of these interviews will take the final form of a 2-3 minute piece, edited down from a 45-minute interview. Also record ambient noise and sonic data from your theme/topic. See example at The Soundlines Project.

2. Textual: a. One 6-8 page final paper per group (double-spaced; between 1500-2000 words). This draft should be divided into sections that include historical information, relevant current facts and anecdotes, and a critical analysis of the map and its meaning. The draft should be clearly marked as to which member of the group authored which sections. We will critique and workshop these papers.
b. Type a transcript from each of your interviews to turn in with final paper (due November 18th)

3. Visual: design, cartography and photography relevant to your project inquiry.

Project resources courtesy of Rachel Nichols and Margaret Noble

  • Gem City Atlas Rebecca Solnit’s work with students at the University of Wyoming
  • Gap Minder– A non-profit venture- a modern “museum” on the Internet – promoting sustainable global development and achievement of the United Nations Millennium Development Goals.
  • Excellent interactive map that details the 2010 census. Plug in your zip code and see what you find.
  • GeoCommons is the public community of GeoIQ users who are building an open repository of data and maps for the world. The GeoIQ platform includes a large number of features that empower you to easily access, visualize and analyze your data.
  • Strange Maps showcases very cool maps and map ideas.
  • Mike Wirth Art Samples from a very creative designer who makes fantastic infographics.
  • Great mapping ideas at radicalcartography
  • Grassroots Mapping – founded by a group of activists, educators, technologists, and community organizers interested in new ways to promote action, intervention, and awareness through a participatory research model.
  • Motion based collaging ideas from Streaming Festival

Images and videos supplied by Margaret Noble
 

Testing or Teachable Moments?

Extinguished
Extinguished

If you read my blog you’ll know that while I support accountability, I’m outraged by the fact that a generation of teachers and students have become slaves to corporatized testing. While our school district mission statements all claim to “foster life-long learners,” in reality, teachers are forced to spend increasing class time prepping kids for predictable tests. … Maybe after they graduate, students will learn how to function in an unpredictable world that devalues routine work and rewards adaptable learners with marketable “soft skills.”

And so today’s Oregonian guest column by Portland teacher, Allen Koshewa, struck a chord with me. He writes:

Several years ago, after I brought in tulips from my garden, my fifth-grade students wanted to plant their own. I learned that few students in my school’s high-poverty community had ever planted anything, so we planted tulips (not in the curriculum). In the process, one student found part of a rusted horseshoe, so we studied the history of the neighborhood (not in the curriculum), discovering that a farm had existed there 90 years earlier. Then, because of the proliferation of questions about the artifacts we’d unearthed, we studied archaeology (not in the curriculum). With the new push for common core standards nationwide, perhaps no student in any fifth grade in the United States will plant tulips, explore the history of his or her neighborhood or learn about archaeology ever again.

I urge you to read his entire essay. As you do, reflect on how the test regime has extinguished the teachable moment. Tulips… to planting… to discovery of horseshoe create the incentive to study local history and techniques of archaeology. Students using one discovery, to pose, and then answer their own questions. Teachable moments that inspire students with purpose, mastery and accomplishment.

Image credit: Flickr/FrasSmith