Games are interaction with rules. They mimic the scientific method – hypothesis tested to overcome obstacles and achieve goal while operating inside prescribed system of boundaries. Video games provide failure based learning – brief, surmountable, exciting. While failure in school is depressing,
in a video game, it’s aspirational.
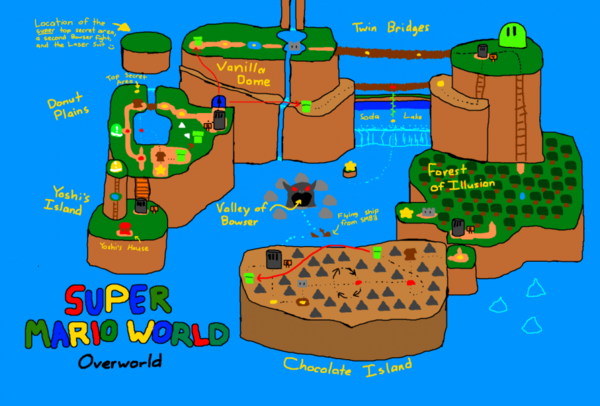
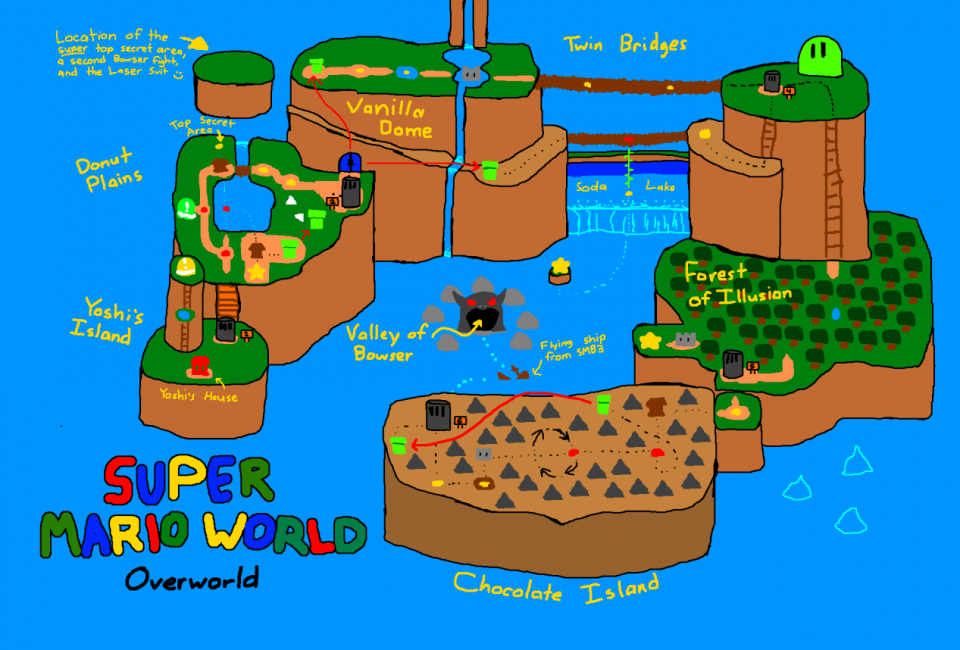
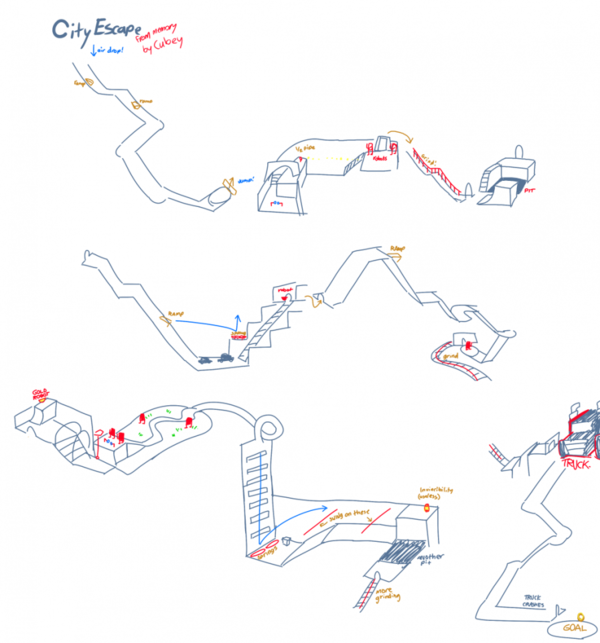
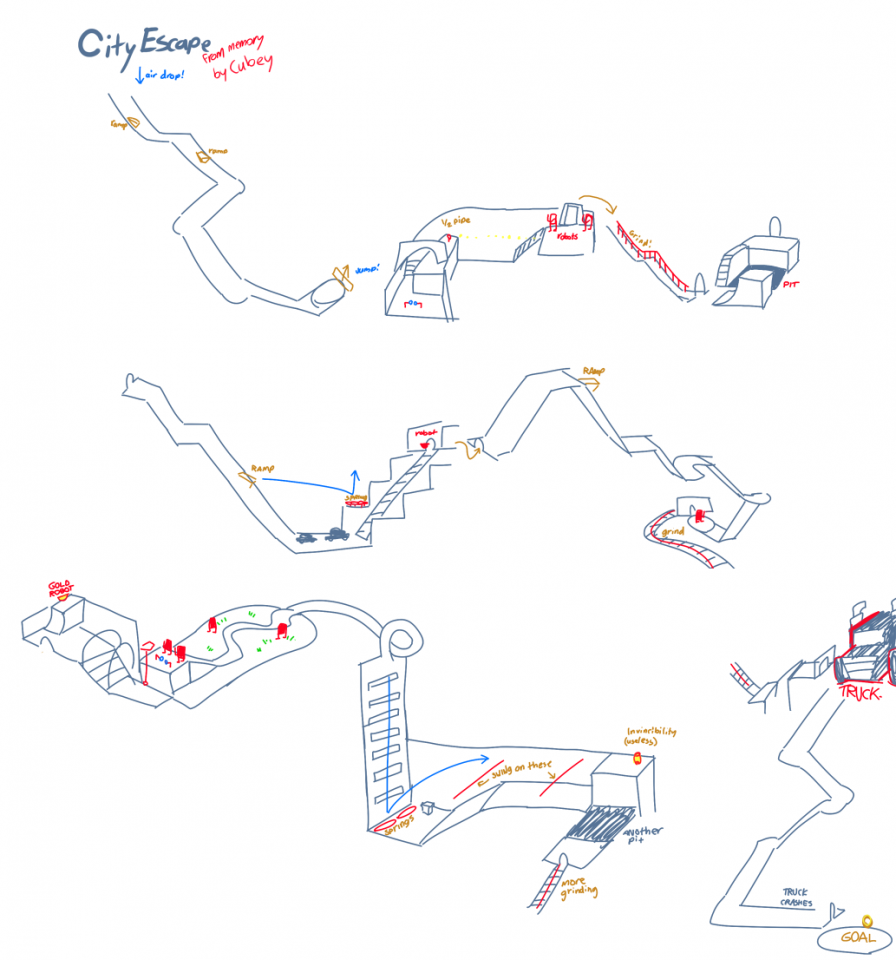
Super Mario World world map by fliptaco
Josh Millard recently began curating a growing collection of video game maps drawn from memory at his site Mapstalgia. He writes,
We spend time in video game worlds, learning our way around the constructed environments. We make mental maps of these places as part of the process of trying to progress through them. We learn where the good bits are hidden, remember the hard bits that got us killed every damn time. The worlds may be fictional but our mental maps of them are as real as anything else we remember. And they’re shared experiences: my experience in Super Mario Bros. was a lot like yours, and even if we never played it together, it’s a space we have in common. And the way our memories overlap, and the ways they differ — the commonalities and contrasts of our individual recalls of these shared spaces — is a really interesting and as far as I’ve seen mostly undocumented emergent result of decades of videogaming experiences. So let’s draw these remembered maps. Let’s put it down on graph paper or napkins or MS Paint.
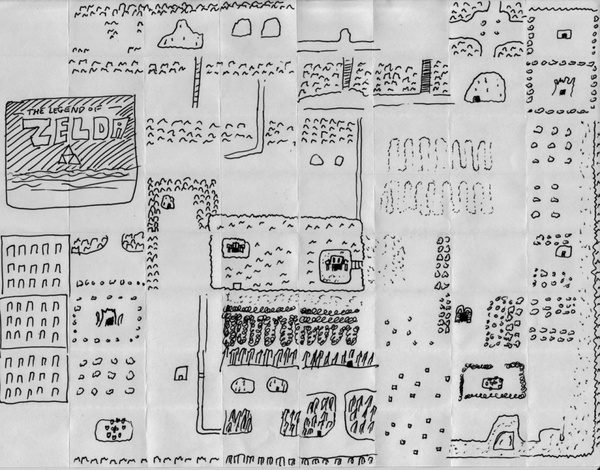
The Legend of Zelda world map by themadjuggler
Submissions range from detailed renderings to simple sketches. They all demonstrate a great way to teach mental mapping skills – spatial relationships, sequence, causation, scale, location, and measurement. Use Mapstalgia to inspire your students. Then give them a chance to have fun while demonstrating their ability to translate gaming worlds into two dimensional representations. Let them compare maps of the same game to design their own mapping rubric. Explore different representations of game elements for clarity and design.
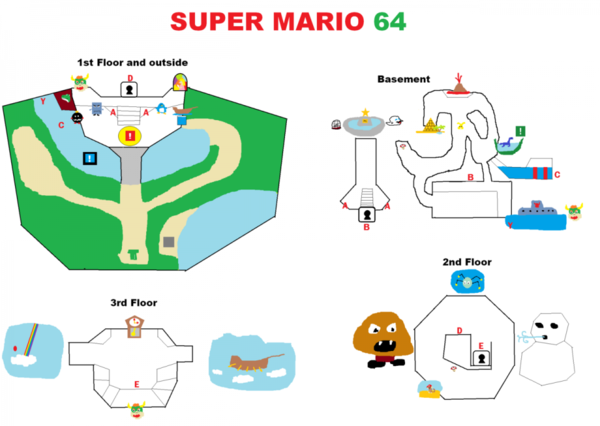
Super Mario 64 Peachs Castle by GNM
Get students hooked working with something they know intimately – video games. Then transfer those visual literacy skills to more traditional mapping instruction as well as exploration of symbolic representations of all kinds.
It’s unfortunate that student don’t get to use their innate perceptual skills more often in the classroom. Instead of discovering patterns on their own, students are “taught” to memorize patterns developed by someone else. Rather than do the messy work of having to figure out what’s going on, students are saddled with graphic organizers which take all the thinking out of the exercise.
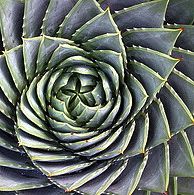
“Doodling in Math Class: Spirals, Fibonacci, and Being a Plant” captures the fascination of patterns in nature. Discover more patterns from Vi Hart – Mathemusician
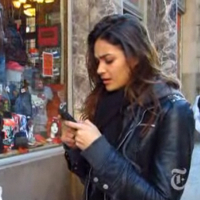
Here’s a clever video by Casey Neistat. Using an novel combination of live action and animation, he tell the story of the dangers of texting while walking. Casey notes,
By mastering the etiquette of texting, I hope we can gain more control over our increasingly electronic lives. Let’s stop acting like hollowed-out zombies, with BlackBerrys and iPhones replacing eye contact, handshakes and face-to-face conversations. It’s time to live once again in the present and simply be where we are. More
As someone who lives in downtown Portland Ore (without a car), I’m always trying to improve my pedestrian etiquette. It might be nice if the drivers stopped texting, as well.
This video is part of the New York Times Op-Docs series – short, opinionated documentaries.
I recently featured a guest post from High Tech High’s David Stahnke and Margaret Noble that detailed their award-winning student multimedia exhibit “Illuminated Mathematics.”
Margaret is back with another student project, partner and guest post. Text by Rachel Nichols and Margaret Noble.
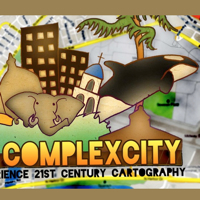
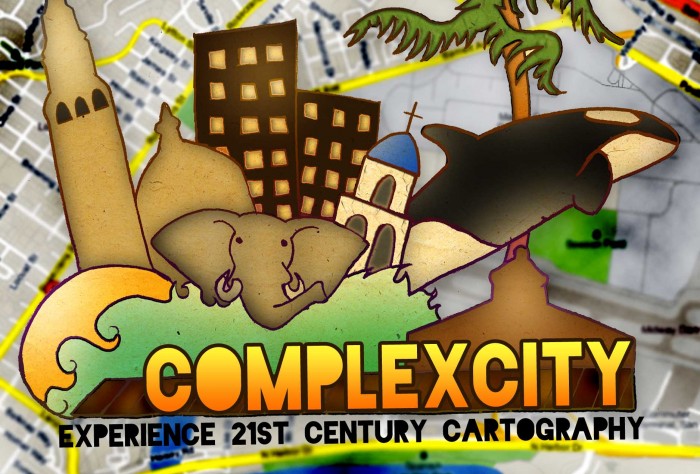
Complex City: Animated Maps of San Diego Project and student exhibition developed and coordinated by High Tech High teachers – Rachel Nichols (English) and Margaret Noble (Multimedia).
Link to the Complex City exhibit sitewith additional student work.
Our Essential (Guiding) Questions
San Diego’s military bases drastically outnumber the facilities meant to help veterans with post war trauma. ~ Tobi Brik
How do we help students to become more aware of their surroundings, in order to foster an educated, ethical, and empathetic community?
How do we facilitate opportunities that help students translate experiences, investigations, and ideas into artistic renderings that effectively communicate new knowledge?
Summary We devised an experiential project, “Complex City” in order to help students think critically about their communities. In asking them to map an area of San Diego that had significance to them, we wanted them to step back from the familiar aspects of their community and city, and translate those aspects into a visual map. As part of this project, students researched, interviewed, and investigated their city and community in myriad ways. What they once thought was familiar suddenly became very unknown. By compiling their work and making collective and idiosyncratic maps of San Diego, they have been challenged to rethink what they understood to be the reality of the built environment around them, as well as to accept the new knowledges that their classmates contribute. They have become more invested in their own community because their new knowledge implicates them as involved citizens. These maps collect particular versions of this place (versions not always visible to others, or in traditional maps) as we see it in the fall/winter of 2011.
Student Assignment
From pursuing this question my love for marine life grew and my desire to help raise awareness for San Diego’s waters grew … I have a responsibility to get reckless boaters to be more cautious. ~ Jasmine Thomas
In this project, you will be making an animated map of San Diego based on your wanderings, interviews, research, and experiences. In short, you will be creating a map of San Diego that collects particular versions of this place (versions not always visible to others, or in traditional maps). Using Rebecca Solnit’s Infinite City as one model, and our own creative explorations as another, we will be collecting data in the form of sounds, photos, historical information, interviews, and ephemera, and we will be compiling this data to make a series of complementary, contradictory, confounding or even contestatory maps of San Diego. We will be looking at Infinite City in detail, as well as working with archivists, historians, and community members to think creatively about mapping.
Bench Marks Research Paper Outline, Story Board of Map – Oral Presentations
Rough Research Draft Paper, Map Draft 2, Final Research Paper
Map Animation Draft 1 with Critiques, Map Animation Revised with Critiques, Final Animation
Public Exhibition – Projection Art and Research Presentations
Complex City Public Exhibition
Three Essential Components:
1. Research Audio: 2-3 interviews relating to the theme/topic of your map. Each of these interviews will take the final form of a 2-3 minute piece, edited down from a 45-minute interview. Also record ambient noise and sonic data from your theme/topic. See example at The Soundlines Project.
2. Textual: a. One 6-8 page final paper per group (double-spaced; between 1500-2000 words). This draft should be divided into sections that include historical information, relevant current facts and anecdotes, and a critical analysis of the map and its meaning. The draft should be clearly marked as to which member of the group authored which sections. We will critique and workshop these papers.
b. Type a transcript from each of your interviews to turn in with final paper (due November 18th)
3. Visual: design, cartography and photography relevant to your project inquiry.
Project resources courtesy of Rachel Nichols and Margaret Noble
Gem City Atlas Rebecca Solnit’s work with students at the University of Wyoming
Gap Minder– A non-profit venture- a modern “museum” on the Internet – promoting sustainable global development and achievement of the United Nations Millennium Development Goals.
Excellent interactive map that details the 2010 census. Plug in your zip code and see what you find.
GeoCommons is the public community of GeoIQ users who are building an open repository of data and maps for the world. The GeoIQ platform includes a large number of features that empower you to easily access, visualize and analyze your data.
Strange Maps showcases very cool maps and map ideas.
Mike Wirth Art Samples from a very creative designer who makes fantastic infographics.
Grassroots Mapping – founded by a group of activists, educators, technologists, and community organizers interested in new ways to promote action, intervention, and awareness through a participatory research model.
If you read my blog you’ll know that while I support accountability, I’m outraged by the fact that a generation of teachers and students have become slaves to corporatized testing. While our school district mission statements all claim to “foster life-long learners,” in reality, teachers are forced to spend increasing class time prepping kids for predictable tests. … Maybe after they graduate, students will learn how to function in an unpredictable world that devalues routine work and rewards adaptable learners with marketable “soft skills.”
And so today’s Oregonian guest column by Portland teacher, Allen Koshewa, struck a chord with me. He writes:
Several years ago, after I brought in tulips from my garden, my fifth-grade students wanted to plant their own. I learned that few students in my school’s high-poverty community had ever planted anything, so we planted tulips (not in the curriculum). In the process, one student found part of a rusted horseshoe, so we studied the history of the neighborhood (not in the curriculum), discovering that a farm had existed there 90 years earlier. Then, because of the proliferation of questions about the artifacts we’d unearthed, we studied archaeology (not in the curriculum). With the new push for common core standards nationwide, perhaps no student in any fifth grade in the United States will plant tulips, explore the history of his or her neighborhood or learn about archaeology ever again.
I urge you to read his entire essay. As you do, reflect on how the test regime has extinguished the teachable moment. Tulips… to planting… to discovery of horseshoe create the incentive to study local history and techniques of archaeology. Students using one discovery, to pose, and then answer their own questions. Teachable moments that inspire students with purpose, mastery and accomplishment.