1950s Red Scare – A Student Designed DBQ

Is this tomorrow america under communism

I assigned my preservice teachers at University of Portland the task of using Learnist to design a document based question that would eventually become part of a class-produced DBQ iBook collection. DBQ assignment here. More samples of student-designed DBQs here.

I’ve asked them to reflect on the assignment and invited them to guest post on my blog.
First up is Red Scare DBQ designed by Christina Steiner & Kristi Convissor.

See Christina and Kristi’s chapter in our class-designed iBook – free at iTunes

You can find Christina at LinkedIn and here’s her posts on our class blog.

Christina Steiner reflects on what she learned from the experience:

“A few weeks ago Kristi Convissor and I started creating a DBQ project. We first started with a general outline the DBQ would take. We asked ourselves “What do we want students to learn from the DBQ overall?” To answer that we came up with a generative question to help guide our designing processing and to help the students when they are using the DBQ. The generative question was: “How does a nation develop such an intense fear and enmity that it creates mass hysteria?”

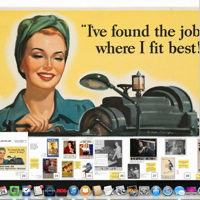
“From there we narrowed it down to look specifically at the Red Scare in 1950s America. We wanted students to learn about Americans fear of communism during the time. We wanted students to not only be aware of the hysteria but to understand where that fear developed from. One of the goals of the DBQ was to get students to think about what kind of words, actions, depictions lead to fear and what kind of outlets are needed to create mass hysteria. If students understand that then they can see how the Red Scare came to encapsulate so much of the 1950s.The design of DBQs lends well to this kind of investigation.

One of the goals of the DBQ was to get students to think about what kind of words, actions, depictions lead to fear …

When creating the DBQ, we chose documents that helped answer the generative question. We had found some cool documents, but they side tracked too far from our question, so we cut them. Having the generative question kept us focused on the main point of the DBQ. In addition we also created follow-up question to each document, which helped us pick quality documents. If the document could only address one question then it probably was not the best source we could use. We made sure to use sources that could be asked several questions because they held a decent amount of information in them for students to discover.

Our DBQ took a media lens to the issue

The final project which can be found on Learnist and soon on an iBook, met our goals. Our DBQ allows students to see for themselves how America came to have such an intense fear of communism through films, articles, and posters. Our DBQ took a media lens to the issue, examining the creation of an enemy based on characterizations rather than on facts or true events.”

Kristi Convissor reflects on what she learned from the experience:
See Kristi’s posts on our class blog. 

Christina Steiner and I have been working on this project for several weeks. We started out with the idea that propaganda is meant to stir feelings in a certain direction, bad or good. Then we decided that we wanted students to recognize the use of propaganda throughout history. Our general question was “What do we want students to learn from the DBQ overall?” The generative question that we formed out of this starting idea was: “How does a nation develop such an intense fear of an enemy, creating mass hysteria?”

We thought that a good starting point to understand such hysteria would be the Red Scare in 1950′s America. We wanted students to learn about the paralyzing fear of communism that existed among Americans at that time. We wanted students to understand what caused such terror to develop. We wanted students to think about what words, images, actions, and depictions might cause fear and what is needed to cause mass hysteria. Student will then be able to understand the driving force of the Red Scare in 1950′s America. The DBQ slowly leads students to think in an investigative manner.

The DBQ slowly leads students to think in an investigative manner.

Christina and I chose documents that would help answer the generative question. We found A LOT of interesting documents and images, but we tried to stick to those that would answer that generative question. This kept us focused on the task at hand. We also ended each document or image with follow-up questions, to scaffold student understanding of propaganda. We wanted each document or image to provide a great deal of information that could lead to greater student discovery and interaction with each piece.

The final project can be found on Learnist and will soon be part of a larger iBook. Through this project, students will come to see and learn how America held such great fear of communism though images, books, comics, films, and posters. We looked specifically at media, examining the creation of enemies based on common perceptions rather than true events or facts.

Image Credit: Wikipedia
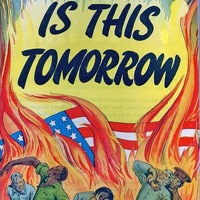
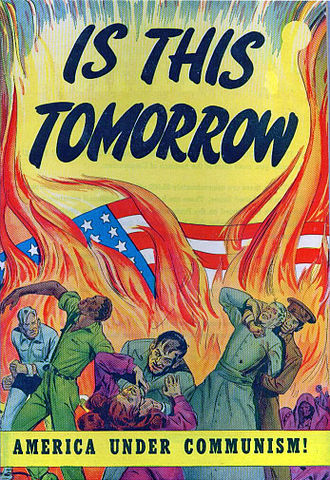
Cover to the propaganda comic book “Is This Tomorrow”‘
Date 1947
Source Catechetical Guild

Learnist: Pinterest for Educators?

The Hirano family, left to right, George, Hisa, and Yasbei. Colorado River Relocation Center, Poston, Arizona., 1942 - 1945
Illustration from Learnist board: Incarceration of Japanese Americans During WWII

I was looking for an online content creation tool to use with my pre-service history teachers at the University of Portland. Our course blog. It had to be an education-friendly, social network that would allow them to post a variety of content, annotate it and provide tools to comment on each other’s work.

They were tasked with designing document based questions (DBQs) that included a variety of source material – text, letters, posters, video, audio. Each DBQ needed an engaging generative / essential question worth answering. It would utilize a series of documents with scaffolding questions designed to help the reader to answer the DBQ’s generative question. See full lesson here.

I considered a variety of social networking curation tools – Pinterest, ScoopIt, etc and posted the question to one of my Google groups. Features I was looking for included: ease of use, space for annotation, user comment, sharing and embedding options. Eventually I settled on Learnist. After reviewing the feedback and trying a few tools our, I settled on Learnist. From my perspective, it’s useful tool with a short learning curve. It lacks many formatting options, but that’s something I like. I’d rather have students focus on content than style.

Learnist proved to be a valuable tool for the students. They were able to post their work and gather feedback from their peers. Since Learnist can be embedded in a blog, they were able to use them as the foundation for guest posts on my blog. See student Learnists here.

Eventually students used the content as the foundation for our class publication of an iBook

Here’s a sample lesson that I created using Learnist Incarceration of Japanese Americans During WWII. I’ll be posting samples of student work soon.

Here’s some comments by my students on Learnist:

  • I enjoyed using Learnist. If anything, it’s a helpful cache of lessons to fall back on in the future. I know that I would like to teach a lesson on the Irish War of Independence, and Learnist provides a useful tool to use in the future. However, the format of Learnist does not lend itself easily to a stand-alone lesson. Rather, it provides the backdrop for a more in-depth and exhaustive lesson, a backdrop student can visualize and access from home. The aesthetics could be improved on the site, such as the use of a full screen document viewer, and more interactive visual presentations. ~ Peter
  • I’m with you, Peter. Learnist is a good idea, but they have a ways to go in terms of developing a user-friendly and aesthetically pleasing experience. Developing our lessons was fun though, and I could see myself using this in some capacity down the road ~ Damian
  • As for Learnist, I think it was a very cool idea, and I really enjoyed reading through some of the lessons that the other students created. ~ Cory
  • As for Learnist, I liked seeing others’ boards. I liked seeing how others were forming their follow-up questions and receiving help from my classmates. I think it is a cool site that I will use once I am a teacher, especially if my school is technologically savvy (fingers crossed!). ~ Christina
  • It was also interesting to see the different ways that other students used Learnist to get different outcomes. I’ll admit, however, that I don’t think I’ll be using this in my classroom anytime soon. It’s just a little bit too clunky for me, and I think that there are other ways that students can create DBQs that are a whole lot easier. ~ Heather
  • It was very interesting to see how everyone used Learnist for their DBQs. After browsing several of the projects, it became clear that people viewed the website in different ways. Now that I have finished my project with Learnist, it is hard to imagine using it in the classroom. Personally, there are just not enough formatting or board layout options to make the site useful for me. Whenever I use technology, the more that I can personalize my project the better. ~ Collin 

Image Credit: Their son was serving in the US Army fighting in Italy, while the Hirano family was incarcerated in the Colorado River Relocation Center, Poston, Arizona.
The Hirano family, left to right, George, Hisa, and Yasbei. Colorado River Relocation Center, Poston, Arizona. 1942 – 1945
Records of the War Relocation Authority
National Archives Identifier: 535989

iBooks Author Widgets on Mavericks Desktop

ibooks mavericks desktop

I’ve been anxiously awaiting the chance to see if iBooks Author (iBA) widgets would make it to the desktop in the new Mavericks version of iBooks. I’m pleased to report that all the iBA – created widgets run perfectly. Plus, viewing an iBook on 27” Thunderbolt display is awesome.

iBA presented a great vehicle for re-envisioning the textbook, but I was never happy with some of it’s features – multiple choice questions and note cards are so old school. When designing my Homefront iBook series, I looked for ways to feature more student interaction with the material. Nonetheless, working in multiple apps on the iPad is challenging.

But with the new Mavericks desktop version, readers will be able to interact with an iBook and simultaneously use other desktop apps to greatly enhance the learning experience. Desktop iBooks easily shares text material via email and social media. You can copy and paste text from an iBook to another app. While you cannot copy / paste an image, I included hyperlinks to all the images I used in my Homefront series so that readers could use digital images to curate their own collections or as part of a design project in another desktop app.

Bottom line – with more screen “real estate” than the iPad and easier use of multiple apps, the desktop version of iBooks provides exciting new opportunities for innovative projects designed using iBooks Author.

Here’s a short video to demonstrate iBA widgets on the desktop.

Student Consultants Design Museum Curriculum and Mobile App

Portrait of Seki Hiromura-Ace's mother and one of the Hiromura boys

If you follow my blog, you’re well aware of my advocacy for project-based learning. So when I was asked to teach a social studies methods class at the University of Portland, I naturally looked for a way to integrate a community-based project that would give my graduate and undergraduate pre-service teachers experience in PBL, the chance to work along side professional historians and an opportunity to make a difference in the community. For more on our course approach, see our class blog.

I live in downtown Portland on the edge of what is known as Old Town / Chinatown. Its a very diverse and historic neighborhood and once the center of a thriving Nihonmachi or “Japantown.” It’s now the home of the Oregon Nikkei Legacy Center, a small museum dedicated to “Sharing and preserving Japanese-American history and culture in Portland’s Old Town neighborhood, where Japantown once thrived.”

I approached the museum with a simple question – “What could you do with a dozen unpaid curriculum consultants?”

While planning my course, I approached the museum with a simple question – “What could you do with a dozen unpaid curriculum consultants?” And so our partnership began – my pre-service history teachers working with professionals at the museum to develop educational material to support their collection. I wanted my student so experience project-based learning from the perspective of the learner in the hopes that they would someday incorporate that approach into their teaching. I also wanted them to recognize that effective teachers are entrepreneurs, actively fostering external partnerships to support learning in their classrooms.

mobile-app-image

After a number of meetings we decided on three projects – an online lesson using curated videos detailing Japanese incarceration, a series of lessons to support an artifact-filled Museum in a Suitcase for circulation to Portland area schools and a iPhone app “Walking Tour of Japantown PDX.” All three projects would extend the reach of the museum and celebrate a once vibrant community that had fallen victim to wartime hysteria.

The app was going to take some technical assistance, so I reached out the Portland’s app community and was able to partner with GammaPoint LLC, PDX-based mobile app developer. We are worked with them to develop Japantown PDX, a native iPhone app walking tour of the historic Japantown in Portland. It features geo-fenced text, photos, audio and tools for sharing user reaction to the content via social media. We are also working with GammaPoint to make this project replicable in the k-20 space.

gallery-1912 Portrait

More on PDX Japantown: During the 1890s Portland was a hub from which Japanese laborers were sent to work in the railroads, canneries, lumber companies and farms throughout the Pacific Northwest. By the 1920s, a steady stream of Japanese “picture brides” had transformed a rough and tumble twelve-block section north of W Burnside between 2nd and 6th Ave into a more respectable Nihonmachi with over 100 Japanese managed businesses and professional office. Portland’s Japantown thrived until the WWII when Issei and Nisei were rounded up by federal officials and incarnated in inland camps. Portland’s Japantown was decimated. After the war a few returned to the old neighborhood, but many took up new residence in Portland’s postwar single family housing boom. The neighborhood had long been home to African-Americans and various immigrant groups. As Chinese-Americans began to predominate in the neighborhood, it gradually became known as Chinatown. Today, even most Portlanders are unaware of it’s heritage as Japantown.

5 Rules of Infographic Excellence

txkcd_infographic

xkcd’s brilliant mockery of the explosion of “info-junk” (at left) should remind us that the best infographics should efficiently combine quantitative data, prompt pattern recognition and cogent visual storytelling.

Perhaps aspiring infographic designers would do well to revisit the work of the Edward Tufte, the guru of the art form. I’ve had a chance to attend one of his inspiring workshops, but you easily appreciate his thinking from his books. In his classic “The Visual Display of Quantitative Information,” he lays out his principles of Graphical Excellence (p 51) Graphical excellence is:

  1. well-designed presentation of interaction data – a matter of substance, statistics and design.
  2. consists of complex ideas communicated with clarity, precision and efficiency.
  3. that which gives the viewer the greatest number of ideas in the shortest time with the least ink in the smallest space.
  4. always multivariate.
  5. requires telling the truth about data.

In the same book he showcases what he feels to be the best narrative graphic of space and time – Charles Joseph Minard representation of Napoleon’s ill-fated invasion of Russia in 1812. Six variable are plotted – the size of the army, it’s location on a two-dimensional surface, direction of the army’s movement, and temperatures on various dates during the retreat from Moscow. The comparative sizes of Napoleon’s invading army (in tan) to his meager retreating forces (in black) tell the story with eloquence.

Click images to enlarge
Minard Napoleon's Iinvasion