Games are interaction with rules. They mimic the scientific method – hypothesis tested to overcome obstacles and achieve goal while operating inside prescribed system of boundaries. Video games provide failure based learning – brief, surmountable, exciting. While failure in school is depressing,
in a video game, it’s aspirational.
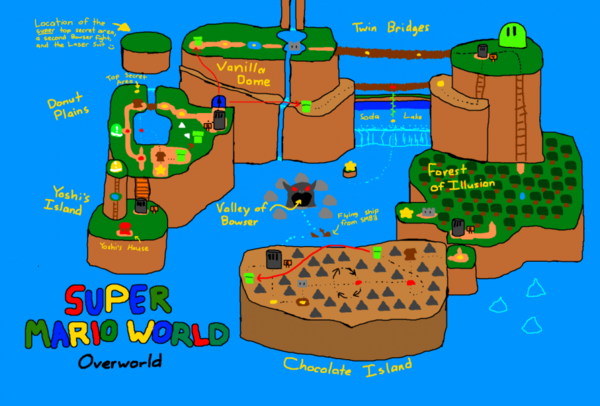
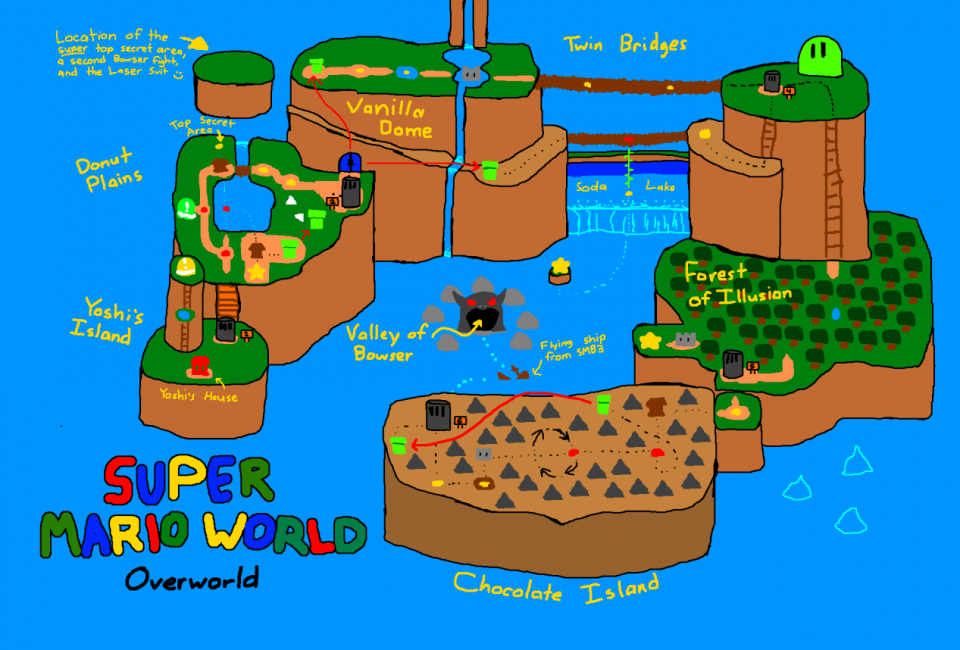
Super Mario World world map by fliptaco
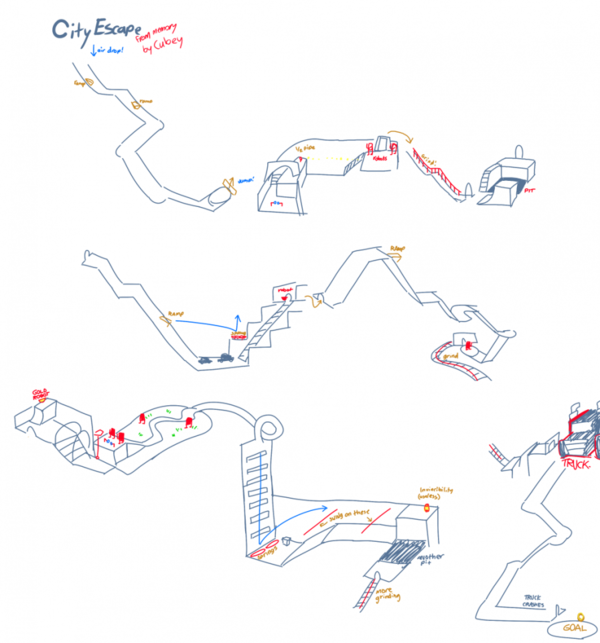
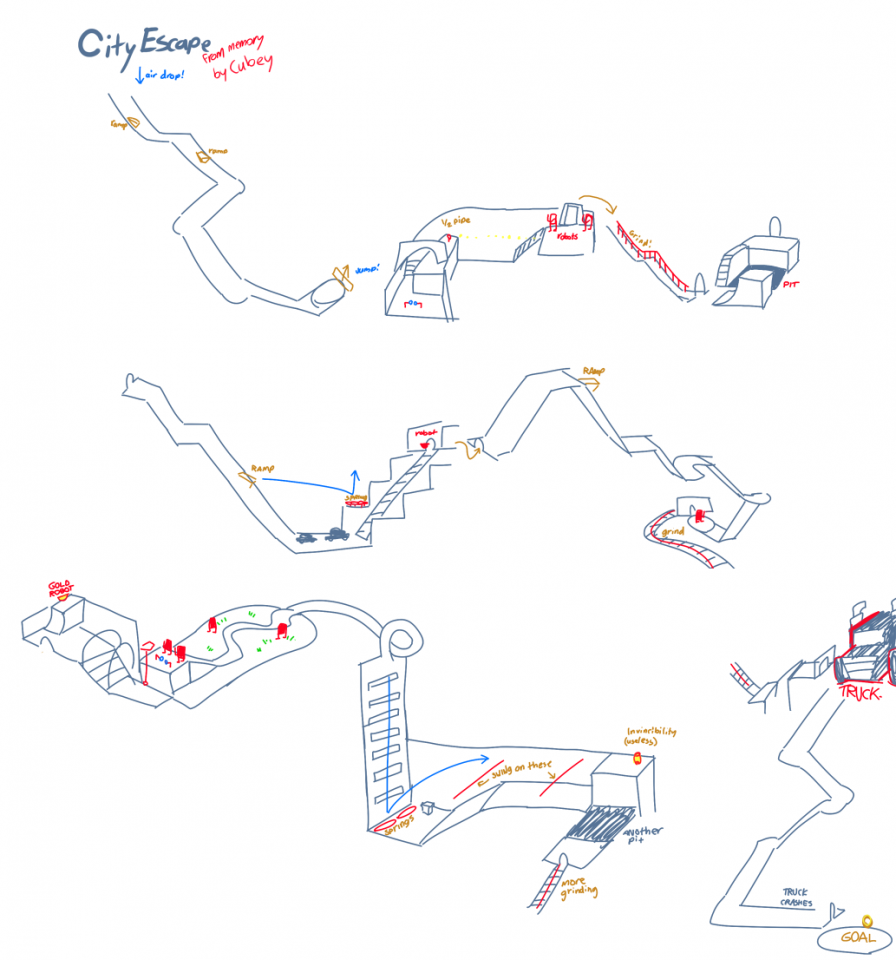
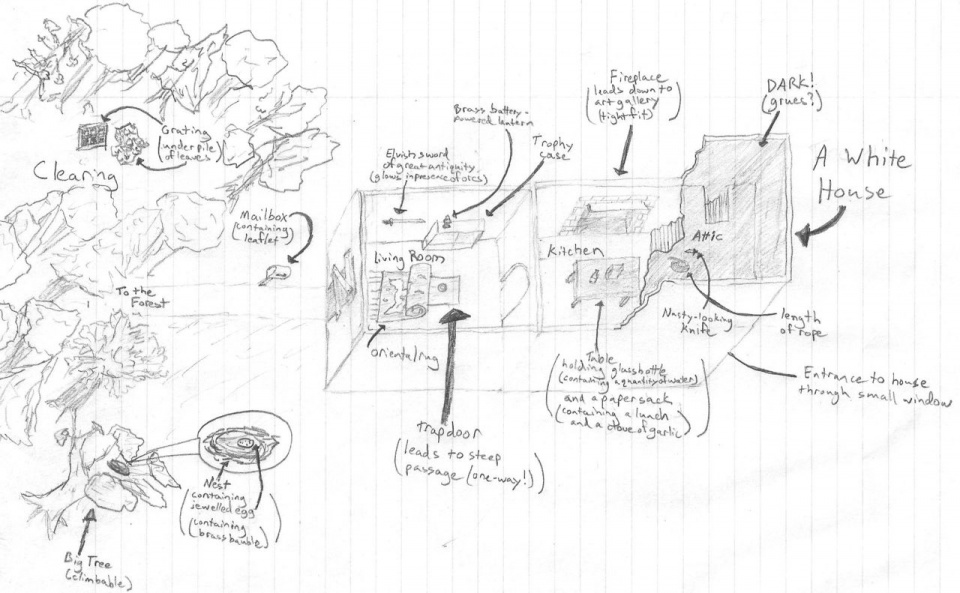
Josh Millard recently began curating a growing collection of video game maps drawn from memory at his site Mapstalgia. He writes,
We spend time in video game worlds, learning our way around the constructed environments. We make mental maps of these places as part of the process of trying to progress through them. We learn where the good bits are hidden, remember the hard bits that got us killed every damn time. The worlds may be fictional but our mental maps of them are as real as anything else we remember. And they’re shared experiences: my experience in Super Mario Bros. was a lot like yours, and even if we never played it together, it’s a space we have in common. And the way our memories overlap, and the ways they differ — the commonalities and contrasts of our individual recalls of these shared spaces — is a really interesting and as far as I’ve seen mostly undocumented emergent result of decades of videogaming experiences. So let’s draw these remembered maps. Let’s put it down on graph paper or napkins or MS Paint.
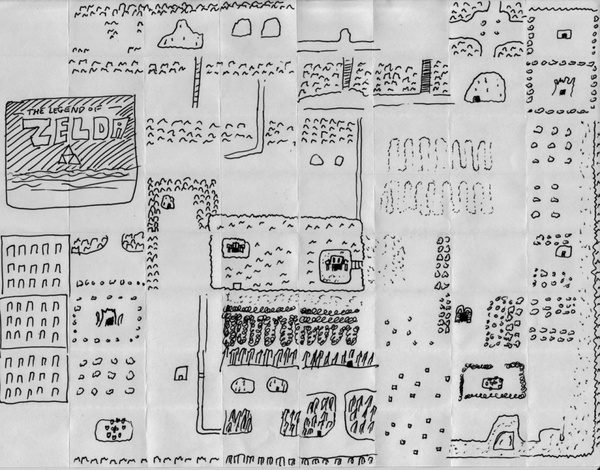
The Legend of Zelda world map by themadjuggler
Submissions range from detailed renderings to simple sketches. They all demonstrate a great way to teach mental mapping skills – spatial relationships, sequence, causation, scale, location, and measurement. Use Mapstalgia to inspire your students. Then give them a chance to have fun while demonstrating their ability to translate gaming worlds into two dimensional representations. Let them compare maps of the same game to design their own mapping rubric. Explore different representations of game elements for clarity and design.
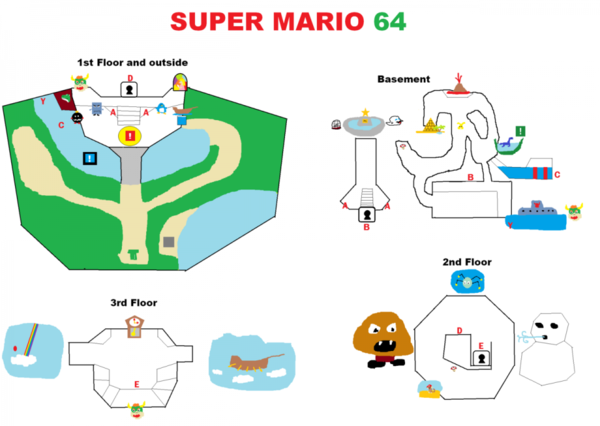
Super Mario 64 Peachs Castle by GNM
Get students hooked working with something they know intimately – video games. Then transfer those visual literacy skills to more traditional mapping instruction as well as exploration of symbolic representations of all kinds.
I recently featured a guest post from High Tech High’s David Stahnke and Margaret Noble that detailed their award-winning student multimedia exhibit “Illuminated Mathematics.”
Margaret is back with another student project, partner and guest post. Text by Rachel Nichols and Margaret Noble.
Complex City: Animated Maps of San Diego Project and student exhibition developed and coordinated by High Tech High teachers – Rachel Nichols (English) and Margaret Noble (Multimedia).
Link to the Complex City exhibit sitewith additional student work.
Our Essential (Guiding) Questions
San Diego’s military bases drastically outnumber the facilities meant to help veterans with post war trauma. ~ Tobi Brik
How do we help students to become more aware of their surroundings, in order to foster an educated, ethical, and empathetic community?
How do we facilitate opportunities that help students translate experiences, investigations, and ideas into artistic renderings that effectively communicate new knowledge?
Summary We devised an experiential project, “Complex City” in order to help students think critically about their communities. In asking them to map an area of San Diego that had significance to them, we wanted them to step back from the familiar aspects of their community and city, and translate those aspects into a visual map. As part of this project, students researched, interviewed, and investigated their city and community in myriad ways. What they once thought was familiar suddenly became very unknown. By compiling their work and making collective and idiosyncratic maps of San Diego, they have been challenged to rethink what they understood to be the reality of the built environment around them, as well as to accept the new knowledges that their classmates contribute. They have become more invested in their own community because their new knowledge implicates them as involved citizens. These maps collect particular versions of this place (versions not always visible to others, or in traditional maps) as we see it in the fall/winter of 2011.
Student Assignment
From pursuing this question my love for marine life grew and my desire to help raise awareness for San Diego’s waters grew … I have a responsibility to get reckless boaters to be more cautious. ~ Jasmine Thomas
In this project, you will be making an animated map of San Diego based on your wanderings, interviews, research, and experiences. In short, you will be creating a map of San Diego that collects particular versions of this place (versions not always visible to others, or in traditional maps). Using Rebecca Solnit’s Infinite City as one model, and our own creative explorations as another, we will be collecting data in the form of sounds, photos, historical information, interviews, and ephemera, and we will be compiling this data to make a series of complementary, contradictory, confounding or even contestatory maps of San Diego. We will be looking at Infinite City in detail, as well as working with archivists, historians, and community members to think creatively about mapping.
Bench Marks Research Paper Outline, Story Board of Map – Oral Presentations
Rough Research Draft Paper, Map Draft 2, Final Research Paper
Map Animation Draft 1 with Critiques, Map Animation Revised with Critiques, Final Animation
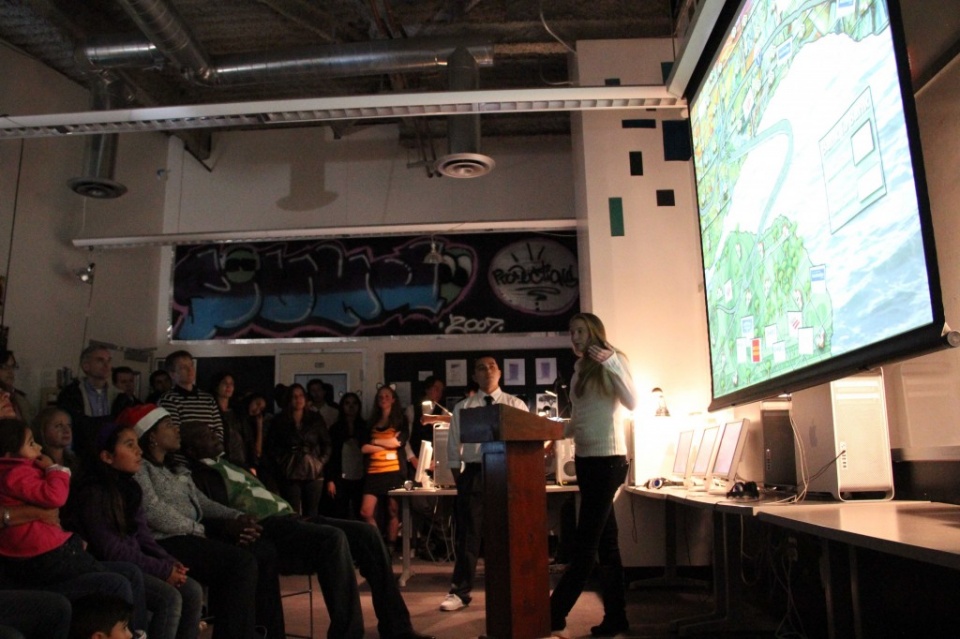
Public Exhibition – Projection Art and Research Presentations
Complex City Public Exhibition
Three Essential Components:
1. Research Audio: 2-3 interviews relating to the theme/topic of your map. Each of these interviews will take the final form of a 2-3 minute piece, edited down from a 45-minute interview. Also record ambient noise and sonic data from your theme/topic. See example at The Soundlines Project.
2. Textual: a. One 6-8 page final paper per group (double-spaced; between 1500-2000 words). This draft should be divided into sections that include historical information, relevant current facts and anecdotes, and a critical analysis of the map and its meaning. The draft should be clearly marked as to which member of the group authored which sections. We will critique and workshop these papers.
b. Type a transcript from each of your interviews to turn in with final paper (due November 18th)
3. Visual: design, cartography and photography relevant to your project inquiry.
Project resources courtesy of Rachel Nichols and Margaret Noble
Gem City Atlas Rebecca Solnit’s work with students at the University of Wyoming
Gap Minder– A non-profit venture- a modern “museum” on the Internet – promoting sustainable global development and achievement of the United Nations Millennium Development Goals.
Excellent interactive map that details the 2010 census. Plug in your zip code and see what you find.
GeoCommons is the public community of GeoIQ users who are building an open repository of data and maps for the world. The GeoIQ platform includes a large number of features that empower you to easily access, visualize and analyze your data.
Strange Maps showcases very cool maps and map ideas.
Mike Wirth Art Samples from a very creative designer who makes fantastic infographics.
Grassroots Mapping – founded by a group of activists, educators, technologists, and community organizers interested in new ways to promote action, intervention, and awareness through a participatory research model.
I recently blogged from the 2011 US Innovative Education Forum (IEF) sponsored by Microsoft Partners in Learning. This is part of a series of IEF guest posts. For more, click my IEF tag. ~ Peter
More than 700 teachers, school leaders, education leaders, and government officials from more than 70 countries attended this year’s 2011 Partners in Learning Global Forum – an action-packed week of education workshops, inspiring networking events, awards, and announcements by Microsoft. Eighteen recipients of the Global Forum Educator Awards were announced at the event. This year’s winners were selected from more than 115 projects, narrowed from more than 200,000 applicants.
The winners in ”Knowledge Building and Critical Thinking” were High Tech High’s Margaret Noble and David Stahnke. “Illuminated Mathematics” is a curated multimedia exhibition produced by the 12th grade class of 2011.Students in Margaret Noble’s digital art class and David Stahnke’s math class were asked to find the beauty, humanity and intrigue behind math in history, philosophy and the applied arts. The goal was to promote math awareness through art, media and design. The event was hosted at the Sushi Performance and Visual Art Center on December 16th, 2010. Projects developed into an array of math abstractions and celebrations in the mediums of sound, video, animation, photography and interactive installation.
~ A guest post written by Dave Stahnke ~ High Tech High Media Arts ~
“Everyone, open your books to chapter 7 section 2 as we will be learning how to factor degree 3 polynomials.”
I can imagine this statement being said, in some fashion, within the vast majority of high school math classrooms across our seemingly broken educational system. Almost all of us have at some point taught something that was completely irrelevant to the lives of our students. And we knew it!
Nobody has ever come up to me on the street and asked for help with factoring, or called me late at night, unable to sleep, because they were curious as to why the square root of two is an irrational number.
The fact is that nobody has ever come up to me on the street and asked for help with factoring, or called me late at night, unable to sleep, because they were curious as to why the square root of two is an irrational number. It is unfortunate that this doesn’t happen, but I would be kidding myself if I thought these were genuine student concerns within the realm of what we call “life.” I think it is time for us as teachers to be honest about what we teach, and to question why every student needs to know the entire breadth of standards associated with a particular subject.
Deep vs. Wide
There was a study published recently in Science Education (2009) that made a comparison between teachers who “sprinted” to cover all of the standards with teachers who slowed down and went deeper into the material. The students who “sprinted” ended up scoring higher on the standardized test due to covering more material. But the students who learned through the slower, in-depth approach earned higher grades in their college classes.
Like any great symphony, mathematics represents a pinnacle of human creativity. We teach math to enrich the lives of our students in a way akin to reading poetry or composing music
Is our goal to have students performing better on standardized tests or to be prepared for what they are going to encounter in college and life? The ideal would be that they would be prepared for both. So the questions become, what do we want to leave the students with? How are we going to prepare them for the real world? What do we want them to learn about themselves? And how do we do it? To clear the air, I don’t believe that students are taking my calculus class because they need help doubling a recipe or balancing their checkbook. I believe it is because we want to expose students to the poetry of numbers, to have a new outlook on how to solve problems, to be able to think outside of the box, and to see how the unbreakable human spirit has conquered problems that once mystified the greatest of thinkers. Like any great symphony, mathematics represents a pinnacle of human creativity. We teach math to enrich the lives of our students in a way akin to reading poetry or composing music.
Bringing Math to Life
This year I wanted to do something big that would change the perception of mathematics for my students and the surrounding community… It was time for math to become art and art to become math.
This year I wanted to do something big that would change the perception of mathematics for my students and the surrounding community. My goal was to create a math exhibition that would allow students to showcase their depth of understanding in a creative way. I wanted nothing to do with the poster-board type of science fair displays. I wanted math to come alive through the work of my students. It was time for math to become art and art to become math.
In order to pull this off it was clear that I was going to need help. After all, having the students for only an hour a day seemed to be great limitation to this type of creativity. I enlisted the help of Margret Noble, a sound artist, multi-media teacher, colleague, and friend. I also got help from as many math/physics friends as I could. I contacted about thirty people. Fifteen were willing to act as mentors, spending time meeting with one or more groups of students and/or corresponding through e-mail. All of the mentors were physics Ph.D. students, or had their PhD and were working in labs or as engineers. The students found the mentors to be a great resource. As one student said, “I got a lot of positive feedback from adults. They helped me understand a very complicated topic in a very simple way.”
Student Voice and Choice
Margaret and I envisioned mixing multimedia with mathematics by having students create video, sound, photography, and mixed media installations that explored math-related topics. We started the project by creating a list of 50 topics for the students to pick from, though they were not restricted to the list. Once the students had selected a topic we had them brainstorm possible creative ways of expressing it (i.e. their product). Each student also completed a research paper on their topic and gave a power point pre-production oral presentation to explain their topic to the rest of the class.
Along the way, students participated in four in-class critiques of their products, with opportunities to revise after each one. For each critique, students displayed their work on the large screen and the rest of the class would give kind, specific, and helpful feedback. These peer critiques were key to ensuring that students produced beautiful products. As they pushed each other’s creativity and offered new ideas, students’ projects evolved into a variety of forms:
A video with animated fractals, another on chaos theory, an artistic representation of tessellations, a flash video on relativity, music produced using Pythagorean scales, photography that displayed entropy, Pi and mental illness in mathematics, a beautiful silent film which used cryptography to crack a love letter, photography and video of the golden ratio, a video/sound installation on algorithmic compositions using Markov chains, a Leonardo da Vinci model airplane explaining the physics of flight, a comical rap on the life of Pythagoras, and many more.
A student who has struggled with math in the past noted that these peer critiques were instrumental in helping students reach their goals:
During the first two critiques I was a little scared because I didn’t think that our project was good enough and had thoughts in my head saying it could be better. But after the second critique I caught fire. I had many more ideas for our project and I was motivated to make it better. On our last critique a lot of good things were said about our project and it felt good knowing that we were that much closer to having a completed senior project.
Student choice also played a critical role. Contrary to what one might assume, having students choose their own topics to explore created some of the most rigorous and authentic student work I have ever seen. Not only did the students have choice in what they were learning, they also chose how they wanted to display it. Furthermore, as the project work progressed, I realized that once the students’ buy in was there, the usual achievement gap between students almost entirely disappeared. This same student found that this project gave him something to be proud of:
I honestly am proud of my project, because our animation came a long way from what we had in the beginning. A lot of hours were put in, learning Adobe After Effects, perfecting the animation, making the concept of infinite monkey theorem as simple as possible, and staying during lunch and after school so we could finish up and meet the deadlines.
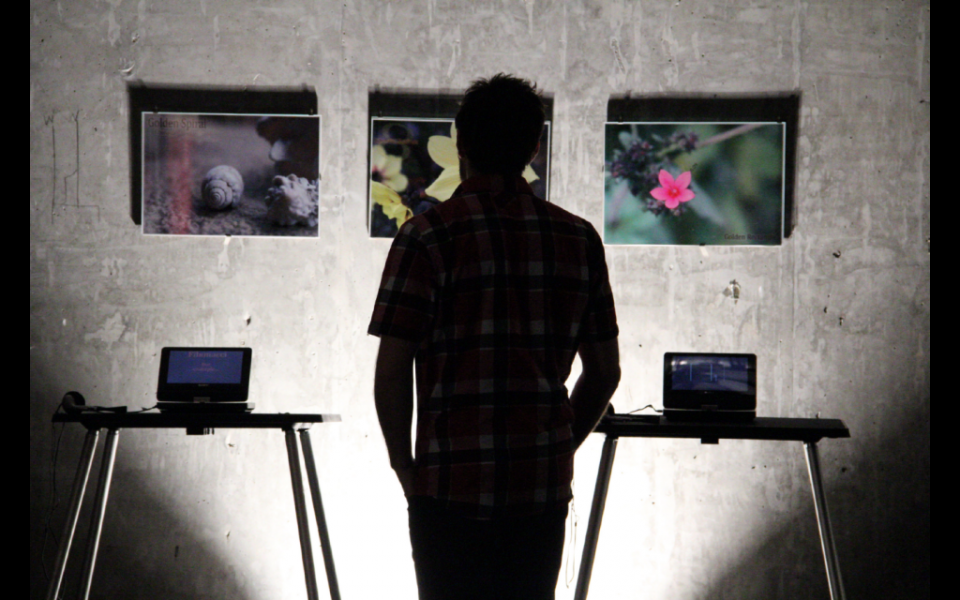
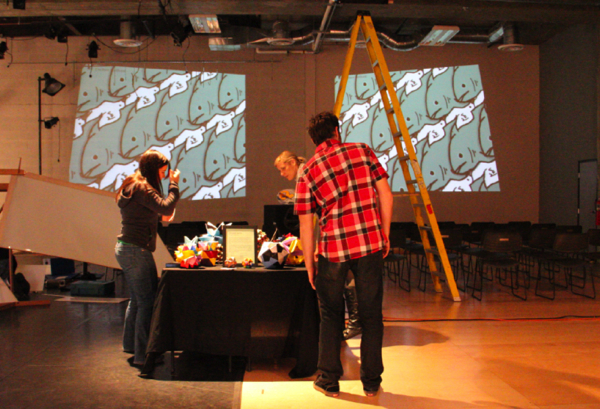
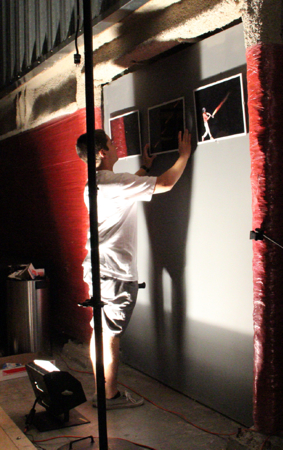
Exhibition
Students exhibited their final work on a Thursday evening at Sushi Contemporary Performance and Visual Arts, a gallery and performance space in downtown San Diego. The venue had professional lighting and ample wall space for multiple projections. It took us two days to set up the exhibition, hanging photos, placing installations, and installing projectors throughout the space. When the lights were turned down and the student work was illuminated it seemed almost magical. Prior to the exhibition, we had reached out to CNBC (video), Voice of San Diego, and City Beat Magazine to help promote the show. The most common phrase I heard that evening from the parents, media, and other visitors was “I can’t believe that high school students did this!”
As an educator, this experience proved to me that mathematics can not only be enjoyable for students, it can be downright memorable. This was possible through giving student choice and by letting them explore math through their own creative personalities. In the words of my teaching partner, Margaret Noble, “This project worked because math moved from the abstract realm into the tangible. Numbers and concepts became people, culture, history and philosophy that students could illuminate to the public.”
Or, as one student said, “It definitely widened my view of math. At first I thought math was only useful to scientists and mathematicians, but this project showed me that math is everywhere.” What more could a math teacher want?
Reference
Schwartz, M., Sadler, P., Sonnert, G. & Tai, R. (September, 2009). Depth versus breadth: How content coverage in high school science courses relates to later success in college science coursework. Science Education, 93, 5, 798-826.
Studio H: Design. Build. Transformis a newexhibit that just opened at Portland’s Museum of Contemporary Craft. It offers visitors an opportunity to immerse themselves in the design process.
While touring the exhibit, I was struck by how the Studio H exhibit embodies the key elements of project-based learning. The PBL approach engages students with the chance to think like professionals while solving real-world problems. Studio H gives PBL added impact by inspiring and empowering student as change agents in their community.
High 5 Studio H
Student-designed solutions that empower people, communities, and economies.
In contrast to PBL, the traditional classroom conditions students to listen to teachers lecture – a one-way flow of information from teacher to passive recipient. And then, if there’s time, students might have a chance to “apply” what they’ve “learned” in a “canned” project (often over-managed with worksheets and a teacher-defined product). But that’s not how we experience life. We encounter challenges that become the catalyst for us to “figure things out.” Thus problem fosters research, analysis, solution, and reflection.
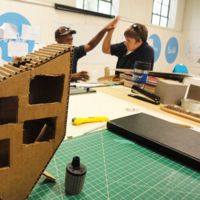
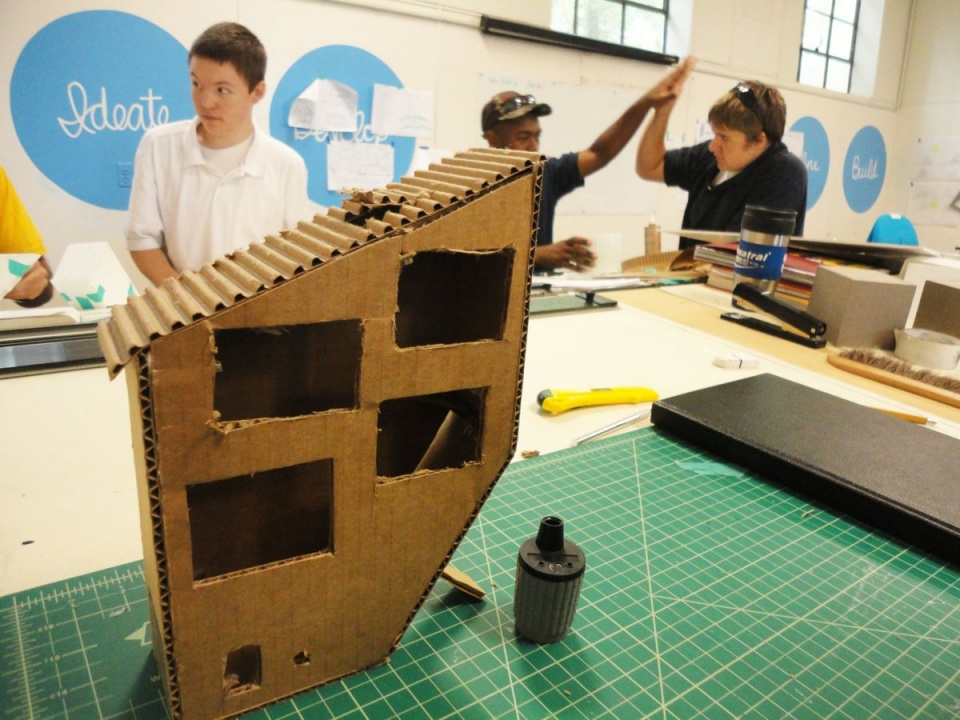
The MoCC’s Studio H exhibit re-imagines the gallery as a laboratory and teaching space. Visitors get to see how students were taught a non-linear design process in a more authentic learning environment that grows out of a dynamic interplay between research, ideation, development, prototyping and building.
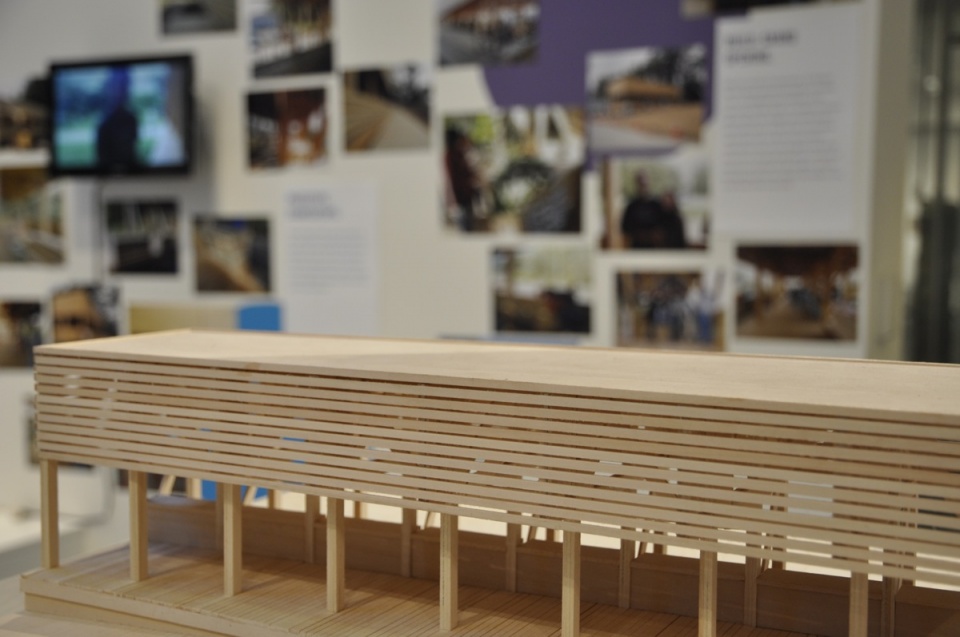
Farmers’ Market Prototype @MoCC
Educators will find the exhibit to be an inspiration and template for using the PBL approach to motivate students with challenge, autonomy, mastery and purpose.
Studio H: Design. Build. Transform Research: Gather relevant contextual precedent and sociological information. Ideate: Generate large amounts of seemingly crazy ideas in quick succession. Develop: Refine promising ideas using functional requirements real-world constraints. Prototype: Build working versions and test their feasibility. Build: Execute and test the prototype in real-world conditions for human interaction dreams.
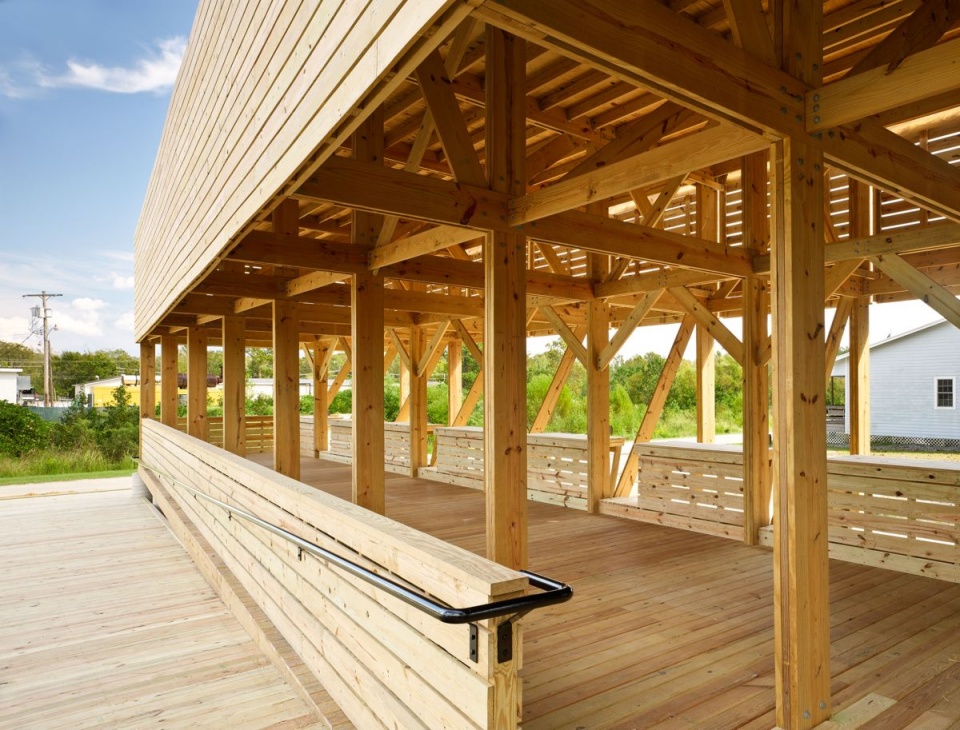
Farmers’ Market – Complete
“A piece of me in every part of this building” ~ Erick
“I’m proud of the market and myself.” ~ Jamesha
“In 30 years, I’ll say I helped build it.” ~ Colin
The exhibition asks viewers to reflect on how that process can teach the next generation of designers to transform the world for themselves. Artifacts from the studio classroom in rural Bertie County, North Carolina (where Emily Pilloton, and Project H partner Matthew Miller, teach design thinking to high-school students) are on display and illustrate how a socially engaged design process can result in significant and positive solutions.
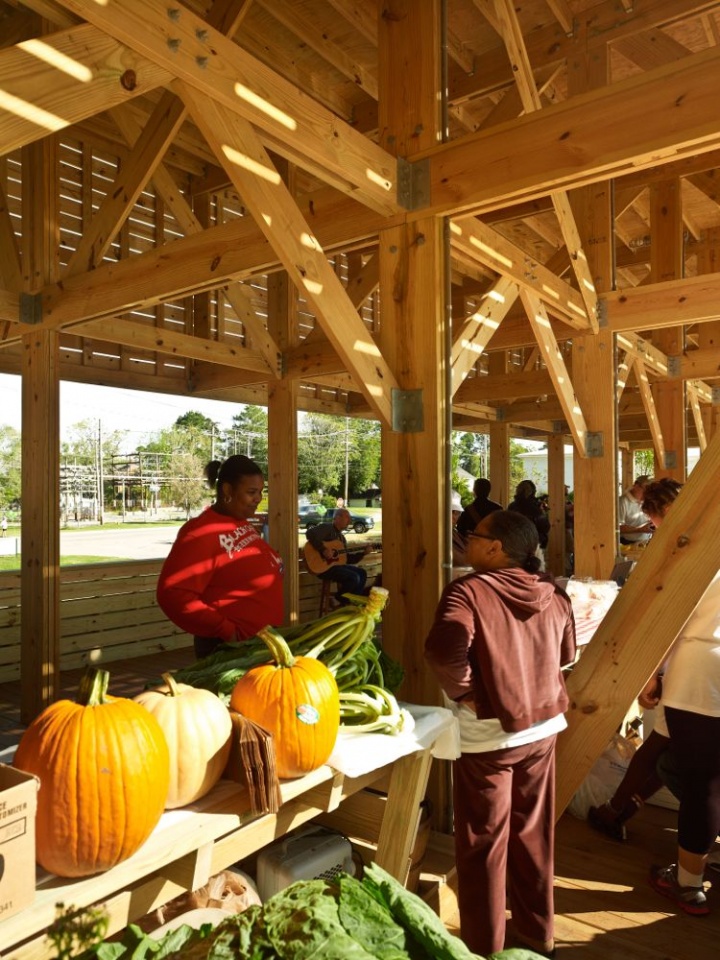
Farmers’ Market – In Operation
The MoCC exhibit highlights the products and process of the first year of the Studio H program. It features two design challenges – chicken coops and a farmers’ market pavilion. Both projects required students to design and build for real-world human (or chicken) interaction. Each project was firmly rooted in the agricultural context of Bertie County, but each looked closely at the local economy and fostered a more sustainable food solution – in one case offering an alternative to the local Perdue-scale chicken agribusiness and in the other, facilitating the production and sale of fresh local produce.
Emily Pilloton exemplifies an emerging generation of designers who believe that design has the power to positively change the world but that new design strategies are required to effect those changes. Pilloton is the founder and director of Project H Design (design initiatives for Humanity, Habitats, Health and Happiness), which connects design to the people who need it most and to the places where it can make a real and lasting difference.
Pilloton and Miller moved to rural Bertie County, North Carolina in 2009 to engage in a bold experiment of design-led community transformation. Through a design/build high-school shop class called Studio H, Pilloton and Miller exercised both minds and bodies while bringing design strategies and new opportunities to the poorest county in the state. In August 2010 they began teaching their first class of 13 students.
We need to go beyond “going green,” Pilloton says, and enlist a new generation of design activists. We need big hearts, a bigger business sense, and the bravery to take action now.
The Studio H website is loaded with photographs, videos, student reflections and great curriculum ideas. The site describes the curriculum as follows:
Studio H is a public high school “design/build” curriculum that sparks rural community development through real-world, built projects. By learning through a design sensibility, applied core subjects, and industry-relevant construction skills, students develop the creative capital, critical thinking, and citizenship necessary for their own success and for the future of their communities.
Over the course of one calendar year, students earn high school and college credit, and are paid a summer wage to build the community project they have spent the year designing and prototyping.
Studio H is a different kind of classroom. We design, build, and transform.
The Museum of Contemporary Craft is sponsoring a Craftperspective Lecture by Emily Pilloton at ZIBA Auditorium 810 NW Marshall Street in Portland Ore on Dec 2, 2011 at 6 PM. Arrive early – it will be packed! More info
~~~~~~~~~~
Note from Peter: I’ve had some discussions with the folks at MoCC about offering a January teacher’s workshop. “Studio H and Getting Started with Project-Based Learning.” Stop back for more information.
~~~~~~~~~~
Image credits:
High Five by Studio H
Farmers’ Market Complete and In Operation by Brad Feinknopf.
Prototype @MoCC by Peter Pappas.
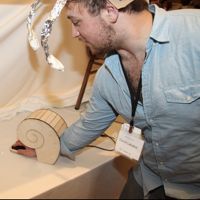
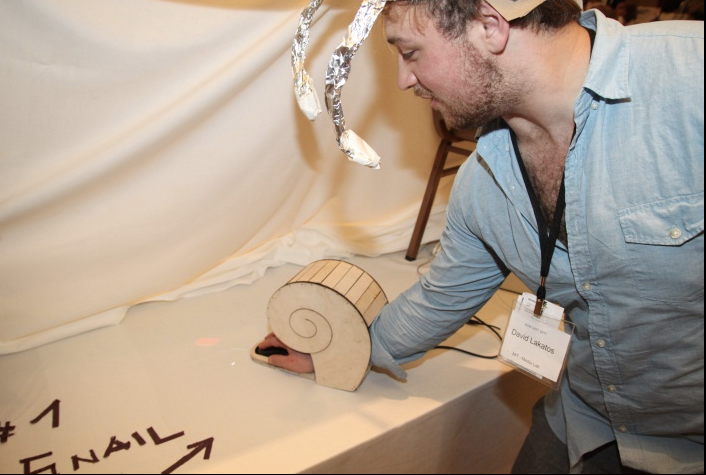
OK, it’s not really a better mouse trap…. but it is a better mouse. Winners of the third annual 2011 UIST Student Innovation Contest (SIC) have been announced. Student teams were given a new Microsoft TouchMouse and provided with a pre-release of the TouchMouse API. The goal of the contest was to design new interactions using this state-of-the-art hardware. For more on the contest and all the winners.