How To Quantify Culture? Explore 500 Billion Published Words With Google’s Books Ngram Viewer

By now you must be aware that Google has been busy digitizing books – over 5 million are now available for free download and search. Recently Google Labs has made public a giant database of of names, words and phrases found in those books (along with the years they appeared). It consists of the 500 billion words contained in scanned books published between 1500 and 2008 in English, French, Spanish, German, Chinese and Russian. 

Google Labs has just posted the “Books Ngram Viewer” – a free online research tool that allows you to quickly analyze the frequency of names, words and phrases -and when they appeared in the digitized books. You type in words and / or phrases (separated by comma), set the date range, and click “Search lots of books” – instantly you get the results. Note: when “smoothing” is set to “0” the results will show raw data. Using a higher number produces an average – example “4” will give you four year running averages that will more readily display trends. 

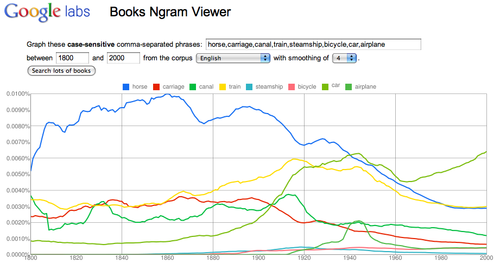
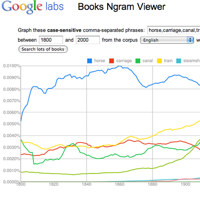
In this graph I searched “horse, carriage, canal, train, steamship, bicycle, car, airplane” and set the date range to 1800 – 2000.  Link to this transport graph at Books Ngram Viewer The results offer some insights into when these new transportation terms found their way into print. 

Transport-1

I think Books Ngram Viewer has many interesting applications in the classroom. The first that comes to mind, is as tool to introduce the research method – form hypothesis, gather and analyze data, revise hypothesis (as needed), draw conclusions, assess research methods. Working in teams students can easily pose research questions, run the data, revise and assess their research strategy. Students can quickly make and test predictions. They can then present and defend their conclusions to other classroom groups. All skills called for by the new Common Core standards.

Using the Ngram viewer, will enable students to discover many insights which will require revisions to their research strategies – a great way to explore word usage, social context and statistics. Words have multiple meanings. In my transport example “car” appears in the graph long before the advent of the automobile. Was it used as railroad car? In contrast to newspapers, events and trends take time to find their way into books. “Pearl Harbor” does not reach a peak until 1945.

The frequency of occurrence scale is important (vertical Y-axis.) If you graph a high frequency word against a low frequency word(s), the low is reduced to a flat line at the base of the scale. (Abraham Lincoln and Marilyn Monroe) Remove the high frequency (Abraham Lincoln) and re-run the graph – the low frequency (Marilyn Monroe) will appear with more detail. 

Need inspiration for nGrams? For a collection of clever searches Click here.

Updates: 

NGram Viewer has added a * wildcard feature. More on how to use it here Hat tip to Jean-Baptiste Michel of the nGram team who emailed me “In English, the data is good in 1800-2000, but not really before or after. Past that date, it looks like the composition of the corpus is changing; trends would indicate a shift in the corpus, not a shift in the underlying culture. So really, one shouldn’t look at data past 2000 in English.”

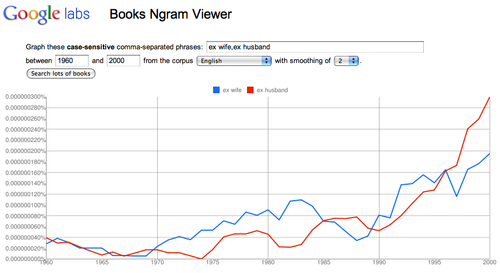
Analyze societal values: “ex wife, ex husband”  
 Changing laws and social values?
Watch the change in the Y-axis scale – add “my ex” to the original graph.

Ex-1

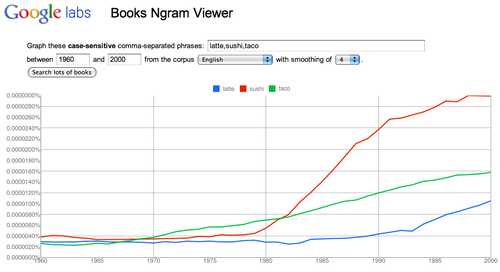
Track trends: “latte, sushi, taco”
Link to graph 
Are these new food fads?
Latte-1
 

Lesson Study: Teacher-Led PD That Works

One of the best aspects of my work is that I get to meet many talented educators. I'm on the road this week, and I invited two of them to do guest posts. The first comes from Matt Karlsen, Project Director of Teaching American History Grants at ESD 112 in Vancouver, Washington. Matt and I first connected on Twitter then recently met over coffee.  I was impressed with the success his group's Lesson Study approach.

There's a hysterical video called “Collaborative Planning” currently going viral.  It’s a "laugh until you cry" feast, one that lays bare the hypocrisy too often evident in teacher professional development where teachers are forced into “Professional Learning Teams” that are none of the above.

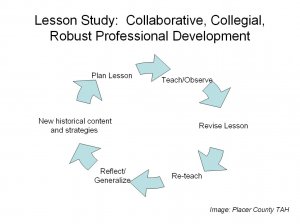
Ls-image1 Thankfully, I’ve been able to work with teachers for the last several years using Lesson Study, a format that is collegial, educative, and transformative.  In our Teaching American History grant funded project, Lesson Study starts with teachers learning new historical content.  They consider state and national thinking and learning targets and examine their students’ work to get a sense of their students’ strengths and struggles.  They form teams to develop a lesson trying to impact student skills and knowledge.  At the same time as helping students answer questions about the historical content, they’re research lessons – helping teachers answer questions they have about teaching and learning.  The group gathers to watch students interact with the lesson, spending the rest of the day discussing observations using this protocol.

Why does it work?

  1. It’s inquiry driven.  Genuine questions guide teachers and students, and the quality of the questions is continually refined to better the learning.  It fosters curiosity.
  2. Teachers are in control.  They decide the lesson targets, the questions they want students to consider and the “problems of practice” they want to investigate.  
  3. Students are the focus.  Ultimately, everything depends on what real students do with the lesson.  Kid-watching eyes are developed as observations become the talking points.
  4. It’s flexible and adaptable.  Regardless of who, what, where, or for how long you’ve been teaching, the process works.

Want to learn more?  

  • Catherine Lewis from Mills College has played a large role in adapting Lesson Study from Japan to the US. The Lesson Study Group at Mills College Resource Page offers links to many informative articles, videos, and books.
  • Oakland Unified School District’s Teaching American History Grants have paved the way for considering Lesson Study in History.  The two videos posted on their site are inspirational starting points for understanding the process.
  • Feel free to contact me (Matt)  to talk about Lesson Study!  It was through open collaboration with others – including Catherine Lewis, Stan Pesick in Oakland, Roni Jones in Placer County, and our TAH partners – that I’ve been able to move down this path.  Let’s extend the Lesson Study professional learning community!
  • Two useful documents for download: 2010-11 LS Review Sheet  and  LS Observation & Debriefing Protocol -Fall 2010

+++++++++++++++

Interested in more teacher-friendly PD? Read my posts: 

Teacher-Led Professional Development: Eleven Reasons Why You Should be Using Classroom Walk Throughs 

A Guide to Designing Effective Professional Development: Essential Questions for the Successful Staff Developer 

The Reflective Teacher: The Taxonomy of Reflection


Need an Election Lesson? Let Student Gerrymander Like a Politician

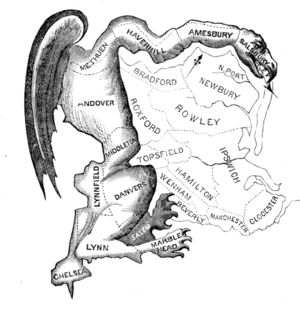
The_GerryMander Most history and government students learn about Gerrymandering – the re-drawing to legislative districts to favor a specific political party. Gerrymandering at Wikipedia.

The 2010 elections will have a major impact on the shape of congressional and state legislative district across the country. Instead of simply telling your students about the impact of the elections – why not give them the chance to gerrymander their own district. 

Link to Gerrymandering lesson

I used this lesson for years with my students and they came up with some remarkable legislative districts that varied greatly based on which party they   were trying to promote. And of course they developed their own understanding of the process, political implications and meaning of gerrymandering.

For more of my history and social studies lessons click here. Let your students be the historian with document based questions

Image from Wikipedia  -  First printed in March 1812, this political cartoon was drawn in reaction to the state senate electoral districts drawn by the Massachusetts legislature to favor the Democratic-Republican Party candidates of Governor Elbridge Gerry over the Federalists. 

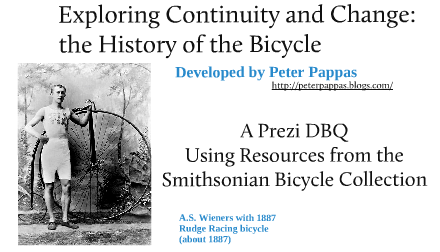
Analyzing the History of the Bicycle: A Prezi DBQ

Prezi-DBQ

Click here to go the Prezi.
Then click “More” to view full screen. Use arrows at base of Prezi to navigate forward and back through a predefined path. Or use your mouse to explore and zoom the Prezi. Click on hyperlinks in the Prezi to more information about the historic bicycles.
For a PDF version of the Prezi click here.

I’m pleased to have been invited by the educators at the Smithsonian Institution to do a guest blog post using museum resources. It’s a great opportunity to illustrate a question that I often pose to educators – when do we stop modeling for students and free them to take responsibility for their learning? For example, the document-based approach (DBQ) can be a great way for students to “be the historian,” but too often we “over curate” the historic material we share with students. When that happens, the teacher is the active historian and the student is merely a passive recipient of information. For more on that subject see my post: Essential Question: Who is the Teacher in Your Classroom? All across the curriculum, students are told to “analyze” material, but their thinking is constrained by the mandated Venn diagram or T-chart. Developing a comparative schema is messy work – but that’s where the learning takes place. (Hint: letting students do the work is also central the the Common Core standards.) When the student fills out the teacher’s Venn diagram, they aren’t analyzing, they’re filing information into predefined locations. 

Of course, students do need proper scaffolding. Opportunities to learn different analytic models – cause / effect, problem / solution, sequencing, continuity / change. It makes sense to provide them some graphic organizers to help master the models. But at some point, you must turn them loose and give them the chance to explore, discover, create. Put another way, if your entire class comes back with the same comparative analysis – you did the thinking, they didn’t.

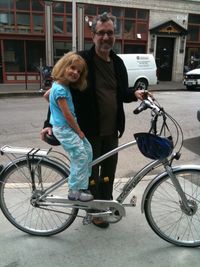
Zoe with Electra I was attracted to the Smithsonian Bicycle collection for two reasons. From an academic perspective, the images of historic bicycles could be analyzed by students without a great deal of background knowledge. My lesson provides a minimum of explanation and gives students more opportunities to develop their own model of how bicycles and bicycle culture evolved over time. On the personal side, much of the year, I live in Portland Oregon –  heartland of the urban bike culture. We don’t own a car, but rely on our bikes, walking and public transport. (That’s me with granddaughter Zoe on my Electra Townie bike). 

Some of my photographs of contemporary bikes are from Portland, where creative types continue to evolve new designs. I’ve been using Prezi on my blog and in my presentations since it was launched. For many years I’ve been an advocate of the DBQ. This is my first attempt to combine the two. 

Step 1: Choosing the Analytic Approach Students need experience using a variety of analytic approaches. Continuity and change is a perspective that has a central role in historic/chronological thinking and it can be used in other disciplines across the curriculum. In this lesson, students are given images of historic bicycles with a minimal amount of supporting text. Starting with concrete observations, students look for patterns of change and continuity (elements that changed, e.g., size / number of wheels, speed, stability and those that remained relatively constant , e.g., human powered, seated posture, need for brakes).  Finally, they are asked develop a way to express what they’ve learned. This gives them an audience other than their teacher.

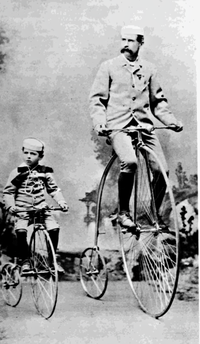
7 dad-son Step 2: Making It Relevant To make learning relevant and set the stage for self-reflection, students need the opportunity to explore their own approaches. For this reason, I don’t provide a graphic organizer. That would mean that I, not the students, did the analysis. This opened-ended assignment invites students to develop their own graphic or narrative model to express what they’ve learned. Another aspect of relevance is authentic audience and purpose. Therefore I recommend that students be asked to think of how they would share their continuity/change model with younger students.

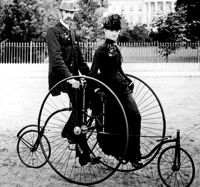
At left: Man astride “1882 Columbia Expert” with son?

Step 3: Making It Rigorous Students should begin by focusing on the lower level comprehension skills (What am I looking at? What materials were used? How were bicycles propelled and steered?) Next they can move to higher level skills.

  • Analysis – What patterns do I see in the bicycles – construction, design, features, uses? What elements do they share in common? How do they differ?
  • Evaluation – In my own judgment, what elements are changing? Which are staying the same? 
  • Creating – What have I learned about continuity and change in the history of the bicycle? How can I represent what I’ve learned to share with others? Should I use a graphic organizer? Flow chart? Time line? Diagram? Narrative?

Step 4: Encouraging Students to Reflect On Their Learning Students that have the opportunity to explore their own approaches have a learning experience that can be a basis for reflection. Since they will likely develop different analytic models than their classmates, they have a chance to compare and learn from each others’ conclusions. When asked to develop a way to explain their model to younger peers, students can reflect on how their model suits their audience and purpose. For reflective prompts you can use with your students see my Taxonomy of Reflection.

Step 5: Taking It Further These possible activity extensions can encourage students to think more about bicycles continuity, and change.

  • Consider how contemporary bicycles fit your continuity / change model, e.g., recumbent, mountain, fixed gear.
  • Design a bicycle
  • Apply the continuity / change model in another subject or discipline – fashion, architecture, musical styles, advertising, fictional characters… I could go on, but I hope you see the potential for learning.
  • Technology extension – Student could also be invited to view the world’s public photography archives at the Flickr Commons with a search by bicycle.They could help describe the photographs they discover by adding tags or leaving comments. The collection includes works from the Smithsonian and other leading international photographic archives.

Learning from Centuries of Play: Students Reenact Bruegel’s “Children’s Games”

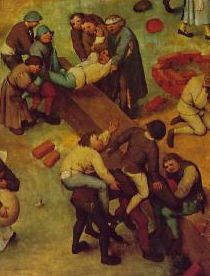
Bruegel_games-detail I was perusing Edward Snow's "Inside Bruegel: The Play of Images in Childrens Games" and impressed with his de-construction of the painting. As a big fan of document based instruction, I got thinking about how much students could learn from a close reading of the work.  Link to painting.

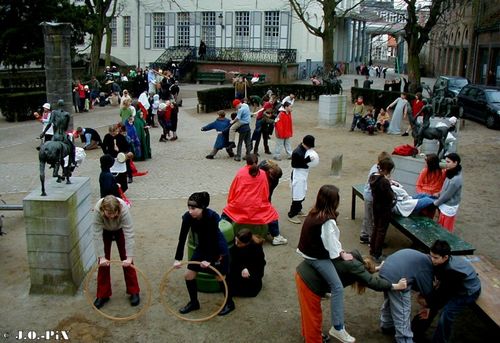
After a search, I found that a group of Belgian students had researched and re-enacted Bruegel the Elder's "Children's Games" (1560) for a class project. I'm reposting it to inspire enterprising teachers and students to try their hand at a reenactment of this (or another work).

Johan Opsomer posted the reenactment in 2007 with the following description:

I developped a project with the children of our school. Each child had to choose a group and a figure. They had some tasks about their figure.  Fill in a 'friends-book' as the figure would do in the Middle ages. Discribe the game and making up the rules. Make a drawing book with the house, the family and the clothes of the figure. Telling the life-story, make a cookbook, a family-tree, etc etc, depending of the age of each of our students. It was a great project and we even were in national newspaper with the project and the picture.

Bruegel-by-Johan Opsomer