Sequencing – An Essential Summarizing Skill

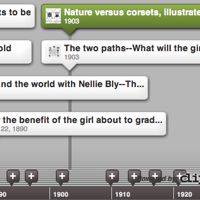
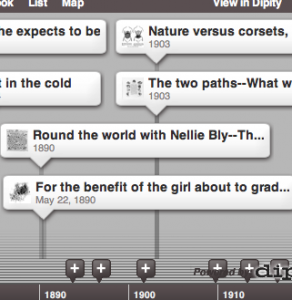
I’ve been experimenting with Dipity, a new website that allows you to build interactive timelines. Open a free account, create a new topic, and then upload text and images (from a file.) You can view your topic as an timeline or flipbook. You can even geocode your events and view the project as a map. You are allowed to set permissions for viewers and editing rights.  I created a sample timeline “How did the roles and rights of women change at the turn of the 20th century?”  Note: One drawback for classroom use – banner ads appear on the page and  I can’t vouch for what might show up.

Dipity allows you to configure the display of the topic and copy and paste the embed code into your page. You should be able to click the embedded image below.

Visualizing Data and Text – A Comparison Learning Strategy that Works

Comparing is the most powerful instructional strategy you can use in the classroom. But it's the person who does the comparing that's learning. Therefore, we must ask students to develop the comparison, not just learn and repeat the model that we present to them. (Remember, asking a student to fill out a Venn diagram that you created, is just a graphic form of information filing). After they have designed their comparison, students should also be asked to share what they learned.  A major component of 21st century literacy is finding meaningful ways to share information with others.

Many Eyes is a great new website that gives teachers and students a chance to easily use sophisticated graphic tools to analyze data and create interactive displays. Those who register at the site can use 16 visualization types to present data. My favorite visualization is the "Wordle," which enables you to see how frequently words appear in uploaded text, or see the relationship between a column of words and a column of numbers. You can tweak your word "clouds" with different fonts, layouts, and color schemes. Why not have your students use Wordle to analyze a selection of non-fiction text to uncover the main ideas and key vocabulary of the piece? Or they could compare text from different sources. Want your students to more fully understand your course content? Let them use Many Eyes to visualize and discover patterns as a catalyst for discussion and collective insights about information, text, and data. As they say at Many Eyes, "Finding the right way view your data is as much an art as a science. The visualizations provided on Many Eyes range from the ordinary to the experimental."

Here's a few examples of the same data in three different Wordle visualizations that analyze the frequency of words in 30 school district mission / vision statements. 

Click on images to enlarge.
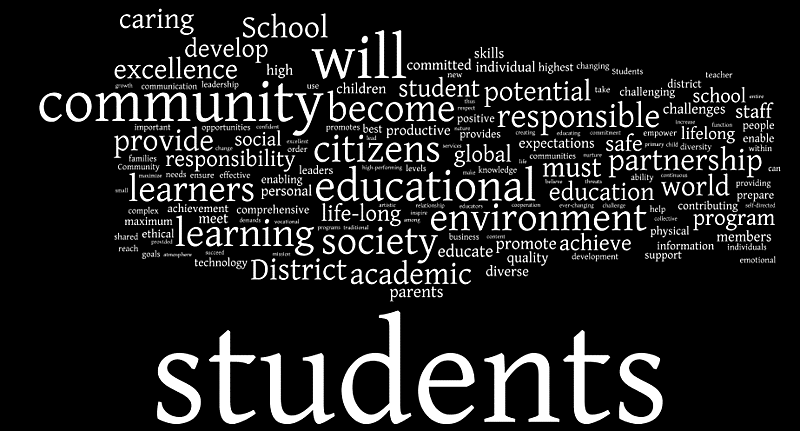
Wordle1

The original data and was uploaded to Many Eyes by PPreuss and used to create the visualization above.  I modified the existing online data set mission / vision statement words with the Wordle tools to represent the same data in different layouts and styles. In this second version (below)  I limited the analysis to the top 100 words.
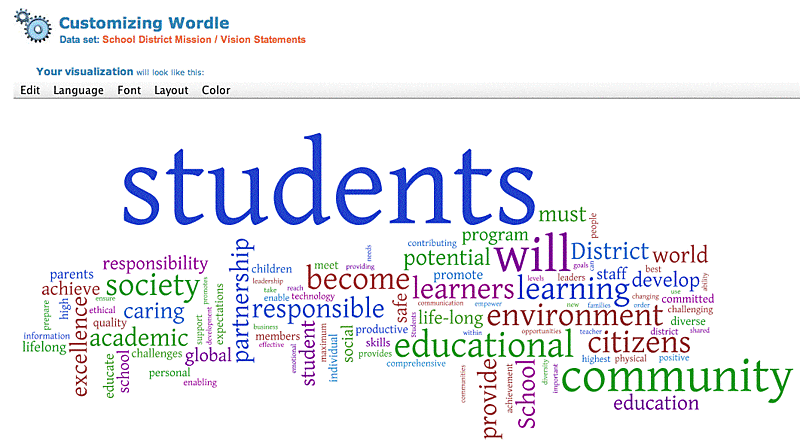
Wordle4

Here's a third representation of the same source data that analyzes 2-word clusters and displays their frequency in alphabetical layout. Below is  a screen shot of the Tag Cloud, but in its original form at Many Eyes, when I click on any of the word clusters,  a pop-up shows the context of how the cluster is used in different sentences from the source mission / vision statements.

Wow! Looks like we educators have a lot on our plates. Personally I think we might want to admit our mission / vision may simply be  "Trying Hard Not To Become Obsolete."
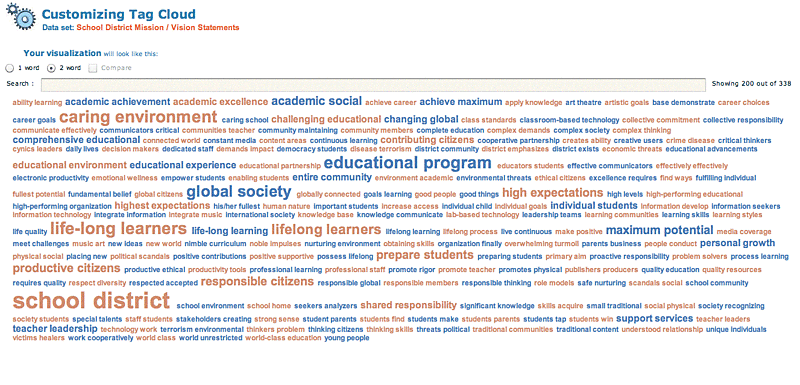
Wordle3

Looking for Copyright-free Historic Images?

The Smithsonian collection of photos has become part of the Flickr Commons group and joins the photo collections of other institutions such as The Library of Congress, the Brooklyn Museum and the Powerhouse Museum. The Commons was launched on January 16 2008, in a pilot project in partnership with The Library of Congress. Both Flickr and the Library were overwhelmed by the positive response to the project!

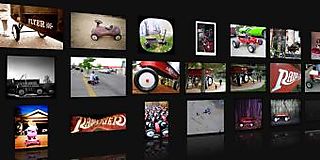
Plus you can search these images with PicLens, a  free plug-in, which works in Internet Explorer, Firefox, Flock, and Safari. It lets you create a moving wall of images where you'd otherwise just see your Web app's more static display of pictures. Launching the viewer is just a matter of clicking a new "play" icon that appears on images when you're on a PicLens-supported site. 

Piclenswall2_340x170

Students Doing History Beats Test Prep

Over the next two weeks I'll be doing presentations that take me back to my roots as a history teacher. I'll be giving the keynote at the Texas Social Studies Supervisors Association spring conference in Austin and giving a workshop for elementary school teachers in the Rochester (NY) City School District.

In both talks I'll show how history and social studies can be used to teach literacy, numeracy and critical thinking. No need to cut back on social studies instructional time to send struggling students for "mind numbing" test prep in reading and math. It begins when teachers provide students with the historical material that kids use to "do the history."  Let's look at two examples – click photos to enlarge

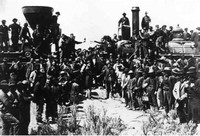
Goldenspike_2 First, a famous photo of the "golden spike" – the final ceremonial spike driven to mark the completion of a transcontinental railroad line in 1869. What can a student learn by looking at the image? Not much, because the important information is not in the image. It's in the background knowledge a student must already possess to interpret it. Unfortunately, this type of photograph dominates our textbooks. It's iconic – it refers to something else that we want students to know.

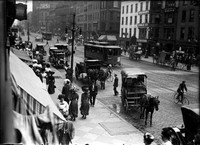
In contrast, here's a photograph of a city street in Rochester NY at the turn of the last century. Stonestreet_3 With very little background information, students can use the photo to do history and interpret the impact of transportation technologies and the pace of change. Then the student could write a "first person account" from the point of view of someone in the photo. They could even go on to design their own comparison of the changes in communication technology in their world today. Perhaps include a graph showing the growth of cell phones vs land lines?

We can design the learning to help our students be the historian. It begins when we allow students to make their own judgments about source material and share what's important to them (instead of just repeating the details the teacher highlights). They'll develop their literacy and numeracy skills for a more authentic audience and purpose as they share their thinking with those around them.

Teaching American History Grant – “Student as Historian”

This  week I  had the opportunity to work with secondary social studies teachers in Volusia County Florida – a talent group who are participating in a multi-year “Teaching American History Grant.”

The focus of my two-day workshop was the “Student as Historian.”  We practiced strategies that teachers can use to shift their role from teacher as “education dispenser” (gathering, distilling and delivering information); to teacher as “educational architect” who can design classrooms where students do the work of constructing meaning. Lessons were designed to enable students to do the work of historian using a variety of comprehension skills:

Identify details – can you identify key symbols, words, visual elements?
Recognizing context – where is this taking place, time period, who’s involved?
Identify relationships – who are these people, what is their relationship to one another?
Identify opinions – is there a point of view expressed in the source information?
Infer meaning – is there meaning that can be extracted from what’s between the lines?
Make predictions – based on the information, what will happen next?

For demonstration, I assembled a group of documents that students could use to answer essential historic questions. I’ve put the documents and guiding activities online at a temporary web site: Selections from an American History Collection