How To Quantify Culture? Explore 500 Billion Published Words With Google’s Books Ngram Viewer

By now you must be aware that Google has been busy digitizing books – over 5 million are now available for free download and search. Recently Google Labs has made public a giant database of of names, words and phrases found in those books (along with the years they appeared). It consists of the 500 billion words contained in scanned books published between 1500 and 2008 in English, French, Spanish, German, Chinese and Russian. 

Google Labs has just posted the “Books Ngram Viewer” – a free online research tool that allows you to quickly analyze the frequency of names, words and phrases -and when they appeared in the digitized books. You type in words and / or phrases (separated by comma), set the date range, and click “Search lots of books” – instantly you get the results. Note: when “smoothing” is set to “0” the results will show raw data. Using a higher number produces an average – example “4” will give you four year running averages that will more readily display trends. 

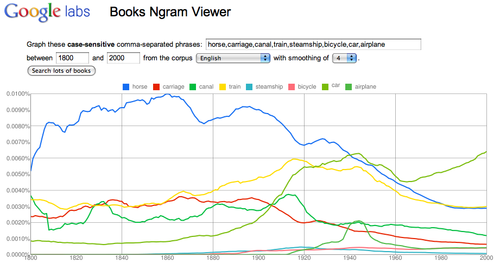
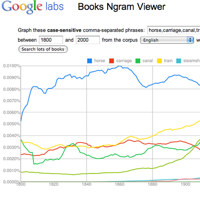
In this graph I searched “horse, carriage, canal, train, steamship, bicycle, car, airplane” and set the date range to 1800 – 2000.  Link to this transport graph at Books Ngram Viewer The results offer some insights into when these new transportation terms found their way into print. 

Transport-1

I think Books Ngram Viewer has many interesting applications in the classroom. The first that comes to mind, is as tool to introduce the research method – form hypothesis, gather and analyze data, revise hypothesis (as needed), draw conclusions, assess research methods. Working in teams students can easily pose research questions, run the data, revise and assess their research strategy. Students can quickly make and test predictions. They can then present and defend their conclusions to other classroom groups. All skills called for by the new Common Core standards.

Using the Ngram viewer, will enable students to discover many insights which will require revisions to their research strategies – a great way to explore word usage, social context and statistics. Words have multiple meanings. In my transport example “car” appears in the graph long before the advent of the automobile. Was it used as railroad car? In contrast to newspapers, events and trends take time to find their way into books. “Pearl Harbor” does not reach a peak until 1945.

The frequency of occurrence scale is important (vertical Y-axis.) If you graph a high frequency word against a low frequency word(s), the low is reduced to a flat line at the base of the scale. (Abraham Lincoln and Marilyn Monroe) Remove the high frequency (Abraham Lincoln) and re-run the graph – the low frequency (Marilyn Monroe) will appear with more detail. 

Need inspiration for nGrams? For a collection of clever searches Click here.

Updates: 

NGram Viewer has added a * wildcard feature. More on how to use it here Hat tip to Jean-Baptiste Michel of the nGram team who emailed me “In English, the data is good in 1800-2000, but not really before or after. Past that date, it looks like the composition of the corpus is changing; trends would indicate a shift in the corpus, not a shift in the underlying culture. So really, one shouldn’t look at data past 2000 in English.”

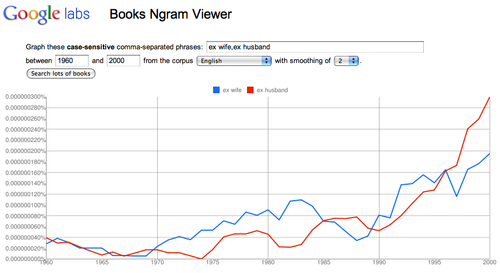
Analyze societal values: “ex wife, ex husband”  
 Changing laws and social values?
Watch the change in the Y-axis scale – add “my ex” to the original graph.

Ex-1

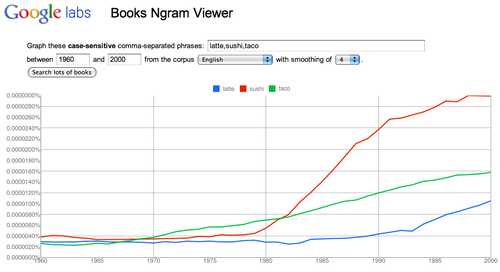
Track trends: “latte, sushi, taco”
Link to graph 
Are these new food fads?
Latte-1
 

Education for Innovation or More Test Prep?

Intel is hosting an education digital town hall at the Newseum that will explore new ways to “cultivate tomorrow’s thinkers and entrepreneurs to sustain economic and educational success.” (December 7 at 8:45 a.m. – 11:45 EST) Participants include Education Secretary Arne Duncan; Angel Gurria, the Secretary General of the Organization for Economic Co-operation and Development; Rob Atkinson with ITIF; and Tom Friedman of the New York Times.

Let’s see how the Duncan sidesteps the issue of testing and innovation – while US students spend endless hours honing their test taking skills, the demand for routine skills has disappeared from the workplace. Anyone know of a meaningful and rewarding career that looks like filling out a worksheet? Maybe Friedman will be willing to tackle the stifling impact of testing on creativity thinking among our students. For my thoughts on the subject, see my post “As NCLB Narrows the Curriculum, Creativity Declines

“Education for Innovation” a live digital town hall 

Watch the video here.

You can submit questions you would like the moderators, PBS NewsHour’s Gwen Ifill and Hari Sreenivasan, to discuss with the speakers. Then, vote the questions you like best to the top. Click here

You can join the for the live, interactive webcast on Tuesday, December 7 at 8:45 a.m. – 11:45 EST or join the conversation at Twitter/InnovationEcon use the hashtag #Ed4Innovation
 

PISA-sample


More on the Program for International Student Assessment (PISA)

PISA is an assessment (begun in 2000) that focuses on 15-year-olds’ capabilities in reading literacy, mathematics literacy, and science literacy. PISA studied students in 41 countries and assessed how well prepared students are for life beyond the classroom by focusing on the application of knowledge and skills to problems with a real-life context. For a detailed example of how PISA assesses sequencing skills see my post “Why Don’t We Teach Sequencing Skills?


For more PISA questions in reading, math and science see my blog post “Are Students Well Prepared to Meet the Challenges of the Future?” You can find some great critical thinking questions to use with your students


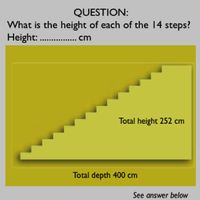
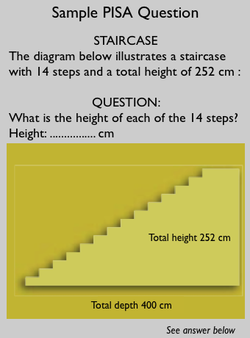
Response to sample question
This short response question is situated in a daily life context. The student has to interpret and solve the problem which uses two different representation modes: language, including numbers, and graphical. This question also has redundant information (i.e., the depth is 400 cm) which can be confusing for students, but this is not unusual in real-world problem solving. The actual procedure needed is a simple division. As this is a basic operation with numbers (252 divided by 14) the question belongs to the reproduction competency cluster. All the required information is presented in a recognizable situation and the students can extract the relevant information from this. The question has a difficulty of 421 score points (Level 2 out of 6).

Turn Your Students into Data-Driven Decision Makers

How is your educational technology being used? Teacher in front of the class lecturing on the smartboard? Or are students using ed tech to analyze, evaluate and create in ways that were not previouslypossible. I’ve written about one example, Wordle, a free Web 2.0 tool that enables students to interpret, qualify and visualizes text in new ways.

Another powerful data visualizer is the Motion Chart. It’s a dynamic flash-based chart that explores multiple indicators and visualizes growth over time. Gapminder World has assembled 600 data indicators in international economy, environment, health, technology and much more. They provide tools that students can use to study real-world issues and discover trends, correlations and solutions. Here’s Gapminders’s Hans Rosling showing how teachers and students can use the free Gapminder Desktop to develop there own motion charts using Gapminder data. 

To download a free version of Gapminder Desktop and access more educational resources go to Gapminder for Teachers. If you would like to build motion charts using your own data visit Google Gadget Motion Chart. (It’s the engine behind Gapminder.)  Motion Chart is a free gadget in Google Spreadsheet. In Motion Chart you can convert your data-series into a Gapminder-like graph and put it on your web-page or blog. All you need is a free Google-account. More info on Motion Chart 

New educational technology does not automatically improve the quality of instruction. We have all sat through dull PowerPoint presentations that were as “mind-numbing” as an overhead. Our return on technology investments may not be tracked in test scores that simply measure lower-order recall of information. A better metric would gauge if an educational technology gave students the tools to analyze, evaluate and create as professionals do. All skills demanded by the new Common Core standards.

Top 100 Tech Tools for Teaching and Learning

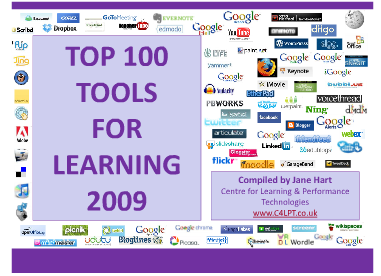
The Centre for Learning & Performance Technologies has assembled a useful survey of top tech tools for learning professionals. Jane Hart of the C4LPT compiled input from nearly 300 ed tech experts from around the globe who were asked to rank their "Top 10 Tools for Learning in 2009." 

The Top 100: Full Survey Results

Top100techtoolsTo get you started, here's the top 10 in order:

Twitter
Delicious
YouTube
Google Reader
Google Docs
WordPress
Slideshare
Google Search
Audacity + Firefox (tied)

The majority of the top 100 are web-based and free – great news for educators in an era of scant educational funding. New the list in 2009 are two of my favorites  - Prezi (presentation software) and Wordle (word cloud generator). For ideas for on how I use these free web resources follow my links to Prezi | Wordle.

Note: The 2010 survey is being in progress All learning professionals are encouraged to share their Top 10 tools to help build it further. Submit here.  Kudos to Jane for conducting the survey.  (And thanks to @russeltarr  for his tweet pointing me to the survey.)

What is the Real Value of Educational Technology?

money

I’ve come to depend on the folks I follow on Twitter to keep me informed and thinking. One of my favorite contributors is Instructional Technology Coordinator, Ben Grey. This morning I followed his tweet to the post “Why Technology?” he did at the TL Advisor Blog.  Ben raised an important question, 

“Something has been happening lately in education, and the implications are a bit unsettling.  People are beginning to ask a cogent question, but I fear it’s being framed for the wrong reason.  I’m hearing more and more important decision makers asking, “Why are we using technology?”

… If tomorrow you had to stand in front of your Board of Education and respond to the question, “why should we continue to use and pursue technology in our district,” what would you say?”  more

I invite you to join Ben’s conversation. I posted a response to his question at the TL blog. But I want to reprint it here to share with my readers. 

My response:

It’s a great question and one that I’ve had to answer as an assistant superintendent for instruction. Here’s a few elements of what I’d say to the school board.

As more information is digitized, we move from a top-down broadcast model of communications to one that fosters creativity and collaboration. The digital age devalues lower-order thinking skills but provides tools that allow us to analyze, evaluate and create. 

New technologies can put our students in charge of the information they access, store, analyze and share.  Many of our students only have access to those tools in our schools. They have the right to participate in the digital age.

Investing in technology should not be a thoughtless response. New technology does not necessarily improve the quality of instruction  (We have all sat through dull PowerPoint presentations that were as “mind-numbing” as an old filmstrip.)

We should continue to look for a ROI on our technology investments, but it may not be tracked in test scores that simply measure lower order recall of information. A better metric would ask if a technology helped us to create learning experiences that provoke student reflection in a new, more engaging and collaborative way. Such as…

  • Wordle, a free Web 2.0 offering allows students to visualize and interpret text. 
  • Google docs allows students to share their thinking in a way that is difficult to replicate on paper. 
  • Web access and social networking allows students to collaborate beyond the confines of the classroom and school day. 

Here’s an example of all three put to use in a collaboration by a self-directed international group of teachers (It was mainly coordinated / promoted via Twitter.) “Build Literacy Skills with Wordle”  

Shouldn’t our students have access to the technologies that allow them to create, collaborate and share their thinking on subjects that matter to them?

Image source: Flickr / Money ~ by PT Money
Money – Feel free to use this image on your blog, website or other publication. Please give attribution (i.e. link) to ‘PT Money’ ptmoney.com