
conference backchannel
One of the goals of my blog is to research, curate and effectively share information with my audience. Conferences are a great aggregator of expertise and information that have inspired some of my most popular blog posts. Here’s three strategies that I’ve used to crowdsource my research and harness the conference backchannel. All three tools employ hashtags – the popular practice where conference attendees include a common tag in their tweets. Typically conference organizers will designate an official hashtag – some combination of letters / numbers prefixed with a hash symbol “#.”
Use Twitter Visualizers
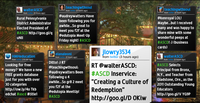 There are many great Twitter visualizers that can be set up to automatically gather specific Twitter #hashtags. Two of my favorites are Wiffiti and Twitter StreamGraphs. Wiffiti displays entire tweets, while StreamGraphs graphs frequency of keywords within the tweets. Both are interesting visualizations of the conference backchannel. Each tool is free and can be embedded on your blog. And neither requires you to attend the conference.
Here’s how I used these visualizers to cover the 2010 ASCD conference.
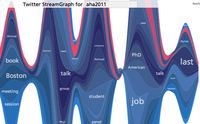 For some fun, I used StreamGraphs to blog “comparative coverage” of two conferences that were in session at the same time in this post, “Humanities Conference Smackdown! AHA vs MLA Twitter Visualizers.”
Use Prezi
 Prezi is a presentation tool that adds a dimension of space and scale to information. It can be displayed both as a stand alone presentation and embedded on a blog. Here’s how I used Prezi at the ITSC 2011 conference in Portland Ore, where I had been invited to attend as a guest blogger. My onsite tools included my MacBook, iPhone and Flip Video.
During the conference I attended sessions to gather photos / video and tweeted my observations along the way. I also gathered content from other attendees by following the conference hashtag #ITSC11. The finished Prezis can include – tweets, images, video, YouTube video, PDF’s, screenshots, text, hyperlinks and clipart.
Periodically I gathered all the content and created a Prezi. (BTW – I used the same Prezi technique to blog the San Antonio ASCD in 2010.)
Use Storify
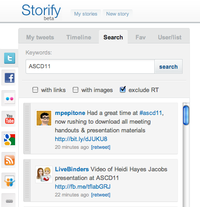 Storify is a new platform that allows users to quickly tell a story using material from the social web. Recently I received an invitation to try out their beta and I’ve been putting it to use as conference blogging tool.
The Storify web-based interface divides your screen in two columns. On the left (screenshot – to the left) are a variety of social media feeds – Twitter, FaceBook, Flickr, YouTube, RSS feeds, Google searches, SlideShare as well as any URL you select. It also has built in search tools that allow you explore your sources using hashtags. My favorite feature is that the Twitter search allows you to exclude RTs. As you find your content, you drag it to the right side of your screen where you also have options to add text, delete or re-order content. When your Storify finished it can be embedded in your blog. To help you get the word out Storify sends out a Tweet to anyone you have quoted.
Here’s how I used Storify to cover the recent 2011 ASCD conference in San Francisco. I received many positive comments from viewers who thought I gathered some of the best social media being posted from the conference. I saved them the time of wading through all the RTs, side comments, and promotional tweets. BTW – I did not attend the conference.
Stay tuned for may ongoing conference coverage – I’m sure there’s a new tool being created that I’ll get to take for a spin!
Like this:
Like Loading...
 I just went to the iTunes App Store, and in one impulsive click, downloaded Al Gore’s companion app to his book “Our Choice: A Plan to Solve the Climate Crisis.”